SY Holdings Group (SEHK:6069) has recently seen some interesting movement in its share price, prompting investors to take a fresh look at its underlying business performance and recent market trends. With noteworthy returns over the past year, there is plenty to consider.
After some rapid gains earlier this year, SY Holdings Group's share price has seen a short-term dip, slipping 3.3% in the past day and 4.9% over the week. Still, momentum remains positive in the long run, with a year-to-date share price return of 50.7% and a standout 59.4% total shareholder return over the last twelve months. This suggests that investor confidence remains resilient despite recent volatility.
Given SY Holdings Group's strong annual returns and robust growth in both revenue and net income, investors are now weighing whether the shares remain undervalued or if the market has already factored in the company's promising outlook. Could there still be a buying opportunity?
Advertisement
Price-to-Earnings of 24.6x: Is it Justified?
SY Holdings Group’s shares are commanding a price-to-earnings ratio of 24.6x, which is notably higher than both peer and industry averages. With a last close price of HK$10.73, the stock appears expensive in the context of its sector.
The price-to-earnings (P/E) ratio shows how much investors are willing to pay today for a dollar of the company’s current earnings. In financial services, this is often used to see if the market is optimistic about future profits compared to established norms within the industry.
For SY Holdings Group, a P/E of 24.6x suggests the market expects substantial growth to justify the premium. However, when measured against the Asian Diversified Financial industry, where the average P/E sits at 17.4x, and compared to the peer average of just 6x, SY Holdings is priced substantially above the norm. The fair P/E ratio for the company is estimated at only 14.5x. This sets a much lower benchmark that the stock could potentially revert toward if growth expectations are not met.
However, slower revenue growth or unexpected regulatory shifts could challenge current market optimism and result in a reassessment of SY Holdings Group's valuation.
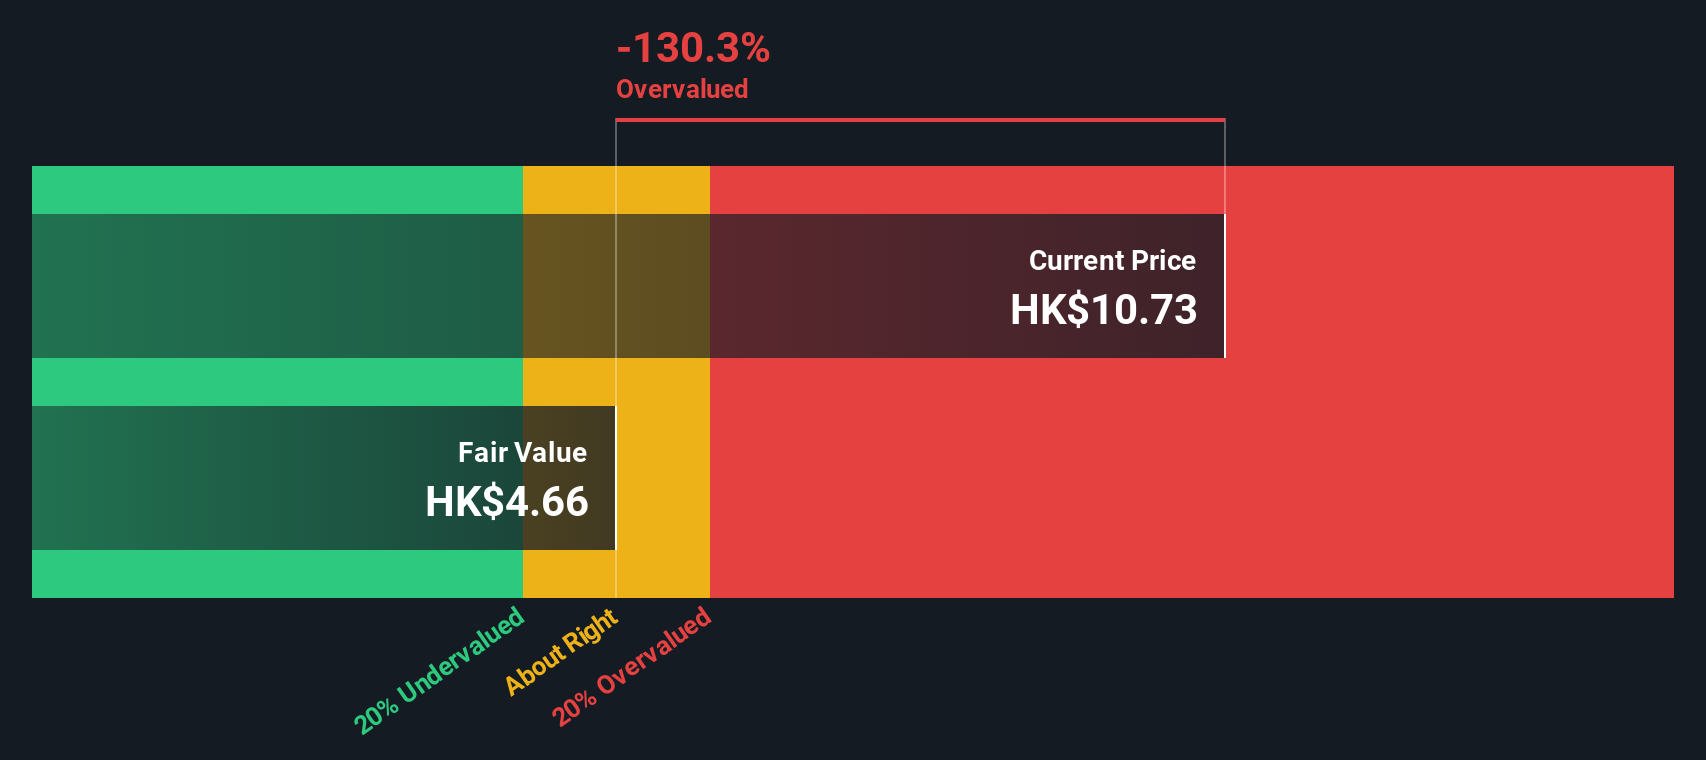
Another View: SWS DCF Model Suggests Overvaluation
Looking at SY Holdings Group from a different angle, our DCF model estimates the fair value at HK$4.66 per share, which is well below the current price of HK$10.73. This suggests the shares could be significantly overvalued if future cash flows do not exceed current market expectations. Could investor optimism be getting ahead of reality?
If you see the story differently or want to dig into the numbers yourself, you can craft your own view in just a few minutes. Do it your way
A great starting point for your SY Holdings Group research is our analysis highlighting 3 key rewards and 1 important warning sign that could impact your investment decision.
Looking for More Promising Opportunities?
Smart investing means always staying ahead of the curve. Expand your horizon and don’t miss out on stocks that could match your goals and portfolio needs.
This article by Simply Wall St is general in nature. We provide commentary based on historical data
and analyst forecasts only using an unbiased methodology and our articles are not intended to be financial advice. It does not constitute a recommendation to buy or sell any stock, and does not take account of your objectives, or your
financial situation. We aim to bring you long-term focused analysis driven by fundamental data.
Note that our analysis may not factor in the latest price-sensitive company announcements or qualitative material.
Simply Wall St has no position in any stocks mentioned.
New: Manage All Your Stock Portfolios in One Place
We've created the ultimate portfolio companion for stock investors, and it's free.
• Connect an unlimited number of Portfolios and see your total in one currency • Be alerted to new Warning Signs or Risks via email or mobile • Track the Fair Value of your stocks