- Hong Kong
- /
- Diversified Financial
- /
- SEHK:2666
Despite delivering investors losses of 6.2% over the past 3 years, Genertec Universal Medical Group (HKG:2666) has been growing its earnings


Investors are understandably disappointed when a stock they own declines in value. But when the market is down, you're bound to have some losers. The Genertec Universal Medical Group Company Limited (HKG:2666) is down 25% over three years, but the total shareholder return is -6.2% once you include the dividend. And that total return actually beats the market decline of 17%. On the other hand, we note it's up 9.0% in about a month.
While the last three years has been tough for Genertec Universal Medical Group shareholders, this past week has shown signs of promise. So let's look at the longer term fundamentals and see if they've been the driver of the negative returns.
Check out our latest analysis for Genertec Universal Medical Group
While the efficient markets hypothesis continues to be taught by some, it has been proven that markets are over-reactive dynamic systems, and investors are not always rational. One way to examine how market sentiment has changed over time is to look at the interaction between a company's share price and its earnings per share (EPS).
During the unfortunate three years of share price decline, Genertec Universal Medical Group actually saw its earnings per share (EPS) improve by 0.5% per year. This is quite a puzzle, and suggests there might be something temporarily buoying the share price. Alternatively, growth expectations may have been unreasonable in the past.
It looks to us like the market was probably too optimistic around growth three years ago. But it's possible a look at other metrics will be enlightening.
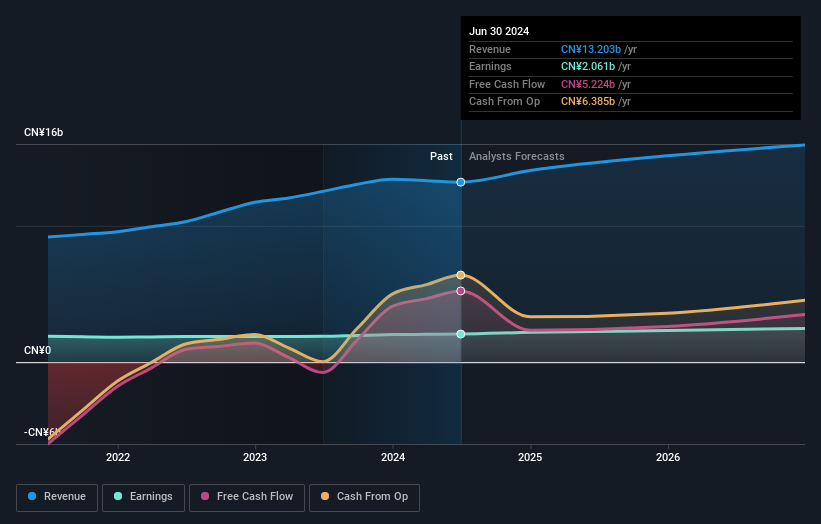
We note that the dividend seems healthy enough, so that probably doesn't explain the share price drop. We like that Genertec Universal Medical Group has actually grown its revenue over the last three years. If the company can keep growing revenue, there may be an opportunity for investors. You might have to dig deeper to understand the recent share price weakness.
The company's revenue and earnings (over time) are depicted in the image below (click to see the exact numbers).
This free interactive report on Genertec Universal Medical Group's balance sheet strength is a great place to start, if you want to investigate the stock further.
What About Dividends?
It is important to consider the total shareholder return, as well as the share price return, for any given stock. Whereas the share price return only reflects the change in the share price, the TSR includes the value of dividends (assuming they were reinvested) and the benefit of any discounted capital raising or spin-off. So for companies that pay a generous dividend, the TSR is often a lot higher than the share price return. As it happens, Genertec Universal Medical Group's TSR for the last 3 years was -6.2%, which exceeds the share price return mentioned earlier. This is largely a result of its dividend payments!
A Different Perspective
It's nice to see that Genertec Universal Medical Group shareholders have received a total shareholder return of 22% over the last year. That's including the dividend. That's better than the annualised return of 3% over half a decade, implying that the company is doing better recently. In the best case scenario, this may hint at some real business momentum, implying that now could be a great time to delve deeper. I find it very interesting to look at share price over the long term as a proxy for business performance. But to truly gain insight, we need to consider other information, too. Like risks, for instance. Every company has them, and we've spotted 2 warning signs for Genertec Universal Medical Group (of which 1 is a bit concerning!) you should know about.
Of course Genertec Universal Medical Group may not be the best stock to buy. So you may wish to see this free collection of growth stocks.
Please note, the market returns quoted in this article reflect the market weighted average returns of stocks that currently trade on Hong Kong exchanges.
New: Manage All Your Stock Portfolios in One Place
We've created the ultimate portfolio companion for stock investors, and it's free.
• Connect an unlimited number of Portfolios and see your total in one currency
• Be alerted to new Warning Signs or Risks via email or mobile
• Track the Fair Value of your stocks
Have feedback on this article? Concerned about the content? Get in touch with us directly. Alternatively, email editorial-team (at) simplywallst.com.
This article by Simply Wall St is general in nature. We provide commentary based on historical data and analyst forecasts only using an unbiased methodology and our articles are not intended to be financial advice. It does not constitute a recommendation to buy or sell any stock, and does not take account of your objectives, or your financial situation. We aim to bring you long-term focused analysis driven by fundamental data. Note that our analysis may not factor in the latest price-sensitive company announcements or qualitative material. Simply Wall St has no position in any stocks mentioned.
About SEHK:2666
Genertec Universal Medical Group
Offers financing and advisory services in the People’s Republic of China.
Undervalued with solid track record.

