Stock Analysis
- Hong Kong
- /
- Diversified Financial
- /
- SEHK:1606
China Development Bank Financial Leasing's (HKG:1606) 118% return outpaced the company's earnings growth over the same one-year period


Unfortunately, investing is risky - companies can and do go bankrupt. But if you pick the right business to buy shares in, you can make more than you can lose. For example, the China Development Bank Financial Leasing Co., Ltd. (HKG:1606) share price had more than doubled in just one year - up 101%. Also pleasing for shareholders was the 19% gain in the last three months. But this move may well have been assisted by the reasonably buoyant market (up 15% in 90 days). Also impressive, the stock is up 89% over three years, making long term shareholders happy, too.
The past week has proven to be lucrative for China Development Bank Financial Leasing investors, so let's see if fundamentals drove the company's one-year performance.
View our latest analysis for China Development Bank Financial Leasing
While the efficient markets hypothesis continues to be taught by some, it has been proven that markets are over-reactive dynamic systems, and investors are not always rational. One imperfect but simple way to consider how the market perception of a company has shifted is to compare the change in the earnings per share (EPS) with the share price movement.
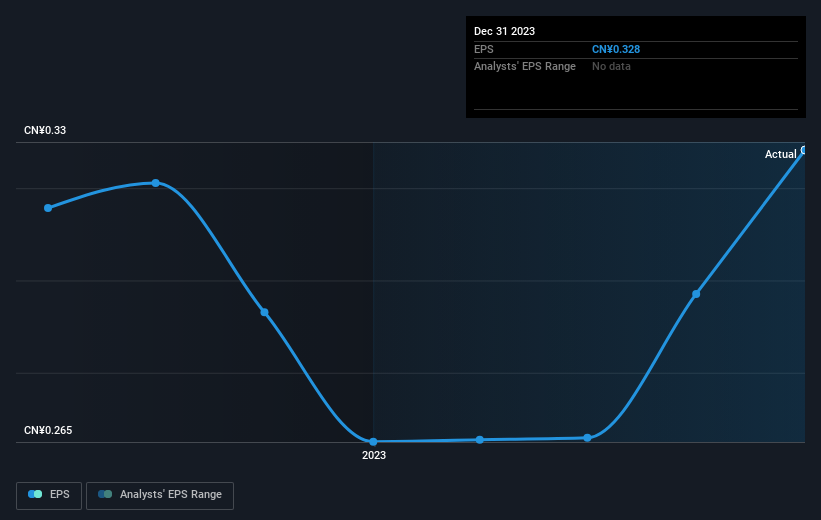
China Development Bank Financial Leasing was able to grow EPS by 24% in the last twelve months. The share price gain of 101% certainly outpaced the EPS growth. This indicates that the market is now more optimistic about the stock.
The company's earnings per share (over time) is depicted in the image below (click to see the exact numbers).
Before buying or selling a stock, we always recommend a close examination of historic growth trends, available here.
What About Dividends?
It is important to consider the total shareholder return, as well as the share price return, for any given stock. The TSR incorporates the value of any spin-offs or discounted capital raisings, along with any dividends, based on the assumption that the dividends are reinvested. Arguably, the TSR gives a more comprehensive picture of the return generated by a stock. In the case of China Development Bank Financial Leasing, it has a TSR of 118% for the last 1 year. That exceeds its share price return that we previously mentioned. This is largely a result of its dividend payments!
A Different Perspective
It's good to see that China Development Bank Financial Leasing has rewarded shareholders with a total shareholder return of 118% in the last twelve months. Of course, that includes the dividend. That's better than the annualised return of 14% over half a decade, implying that the company is doing better recently. Given the share price momentum remains strong, it might be worth taking a closer look at the stock, lest you miss an opportunity. I find it very interesting to look at share price over the long term as a proxy for business performance. But to truly gain insight, we need to consider other information, too. Like risks, for instance. Every company has them, and we've spotted 2 warning signs for China Development Bank Financial Leasing (of which 1 is a bit concerning!) you should know about.
For those who like to find winning investments this free list of growing companies with recent insider purchasing, could be just the ticket.
Please note, the market returns quoted in this article reflect the market weighted average returns of stocks that currently trade on Hong Kong exchanges.
Valuation is complex, but we're helping make it simple.
Find out whether China Development Bank Financial Leasing is potentially over or undervalued by checking out our comprehensive analysis, which includes fair value estimates, risks and warnings, dividends, insider transactions and financial health.
View the Free AnalysisHave feedback on this article? Concerned about the content? Get in touch with us directly. Alternatively, email editorial-team (at) simplywallst.com.
This article by Simply Wall St is general in nature. We provide commentary based on historical data and analyst forecasts only using an unbiased methodology and our articles are not intended to be financial advice. It does not constitute a recommendation to buy or sell any stock, and does not take account of your objectives, or your financial situation. We aim to bring you long-term focused analysis driven by fundamental data. Note that our analysis may not factor in the latest price-sensitive company announcements or qualitative material. Simply Wall St has no position in any stocks mentioned.
About SEHK:1606
China Development Bank Financial Leasing
China Development Bank Financial Leasing Co., Ltd.
Undervalued with solid track record.
