
Advertisement
- Hong Kong
- /
- Hospitality
- /
- SEHK:8367
Risks Still Elevated At These Prices As Simplicity Holding Limited (HKG:8367) Shares Dive 47%
Simplicity Holding Limited (HKG:8367) shareholders won't be pleased to see that the share price has had a very rough month, dropping 47% and undoing the prior period's positive performance. For any long-term shareholders, the last month ends a year to forget by locking in a 84% share price decline.
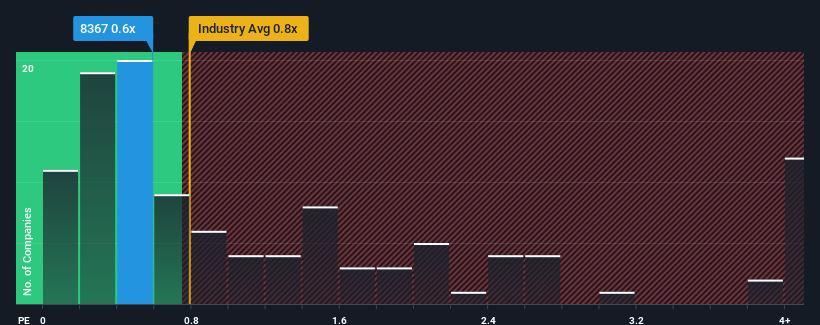
In spite of the heavy fall in price, it's still not a stretch to say that Simplicity Holding's price-to-sales (or "P/S") ratio of 0.6x right now seems quite "middle-of-the-road" compared to the Hospitality industry in Hong Kong, where the median P/S ratio is around 0.8x. While this might not raise any eyebrows, if the P/S ratio is not justified investors could be missing out on a potential opportunity or ignoring looming disappointment.
Check out our latest analysis for Simplicity Holding
What Does Simplicity Holding's Recent Performance Look Like?
Simplicity Holding certainly has been doing a great job lately as it's been growing its revenue at a really rapid pace. It might be that many expect the strong revenue performance to wane, which has kept the share price, and thus the P/S ratio, from rising. If you like the company, you'd be hoping this isn't the case so that you could potentially pick up some stock while it's not quite in favour.
We don't have analyst forecasts, but you can see how recent trends are setting up the company for the future by checking out our free report on Simplicity Holding's earnings, revenue and cash flow.How Is Simplicity Holding's Revenue Growth Trending?
In order to justify its P/S ratio, Simplicity Holding would need to produce growth that's similar to the industry.
If we review the last year of revenue growth, the company posted a terrific increase of 34%. Despite this strong recent growth, it's still struggling to catch up as its three-year revenue frustratingly shrank by 5.9% overall. Therefore, it's fair to say the revenue growth recently has been undesirable for the company.
In contrast to the company, the rest of the industry is expected to grow by 19% over the next year, which really puts the company's recent medium-term revenue decline into perspective.
With this in mind, we find it worrying that Simplicity Holding's P/S exceeds that of its industry peers. It seems most investors are ignoring the recent poor growth rate and are hoping for a turnaround in the company's business prospects. There's a good chance existing shareholders are setting themselves up for future disappointment if the P/S falls to levels more in line with the recent negative growth rates.
What We Can Learn From Simplicity Holding's P/S?
Following Simplicity Holding's share price tumble, its P/S is just clinging on to the industry median P/S. Generally, our preference is to limit the use of the price-to-sales ratio to establishing what the market thinks about the overall health of a company.
The fact that Simplicity Holding currently trades at a P/S on par with the rest of the industry is surprising to us since its recent revenues have been in decline over the medium-term, all while the industry is set to grow. When we see revenue heading backwards in the context of growing industry forecasts, it'd make sense to expect a possible share price decline on the horizon, sending the moderate P/S lower. Unless the recent medium-term conditions improve markedly, investors will have a hard time accepting the share price as fair value.
You always need to take note of risks, for example - Simplicity Holding has 2 warning signs we think you should be aware of.
If you're unsure about the strength of Simplicity Holding's business, why not explore our interactive list of stocks with solid business fundamentals for some other companies you may have missed.
New: Manage All Your Stock Portfolios in One Place
We've created the ultimate portfolio companion for stock investors, and it's free.
• Connect an unlimited number of Portfolios and see your total in one currency
• Be alerted to new Warning Signs or Risks via email or mobile
• Track the Fair Value of your stocks
Have feedback on this article? Concerned about the content? Get in touch with us directly. Alternatively, email editorial-team (at) simplywallst.com.
This article by Simply Wall St is general in nature. We provide commentary based on historical data and analyst forecasts only using an unbiased methodology and our articles are not intended to be financial advice. It does not constitute a recommendation to buy or sell any stock, and does not take account of your objectives, or your financial situation. We aim to bring you long-term focused analysis driven by fundamental data. Note that our analysis may not factor in the latest price-sensitive company announcements or qualitative material. Simply Wall St has no position in any stocks mentioned.
Have feedback on this article? Concerned about the content? Get in touch with us directly. Alternatively, email editorial-team@simplywallst.com
About SEHK:8367
Simplicity Holding
An investment holding company, operates casual dining full-service restaurants in Hong Kong.
Excellent balance sheet and good value.
Market Insights

Advertisement
Community Narratives
The "Molecular Pencil": Why Beam's Technology is Built to Win
Fair Value US$65.01|65.8% undervalued
DA
Community Contributor
The silent giant behind virtually every advanced chip powering AI, smartphones, and modern infrastructure.
Fair Value US$310.00|7.6% undervalued
OS
Community Contributor
ADP Stock: Solid Fundamentals, But AI Investments Test Its Margin Resilience
Fair Value US$387.77|34.5% undervalued
YI
Community Contributor