- Hong Kong
- /
- Hospitality
- /
- SEHK:6889
DYNAM JAPAN HOLDINGS' (HKG:6889) earnings have declined over five years, contributing to shareholders 42% loss


DYNAM JAPAN HOLDINGS Co., Ltd. (HKG:6889) shareholders should be happy to see the share price up 12% in the last week. But if you look at the last five years the returns have not been good. You would have done a lot better buying an index fund, since the stock has dropped 57% in that half decade.
While the last five years has been tough for DYNAM JAPAN HOLDINGS shareholders, this past week has shown signs of promise. So let's look at the longer term fundamentals and see if they've been the driver of the negative returns.
Check out our latest analysis for DYNAM JAPAN HOLDINGS
To quote Buffett, 'Ships will sail around the world but the Flat Earth Society will flourish. There will continue to be wide discrepancies between price and value in the marketplace...' One way to examine how market sentiment has changed over time is to look at the interaction between a company's share price and its earnings per share (EPS).
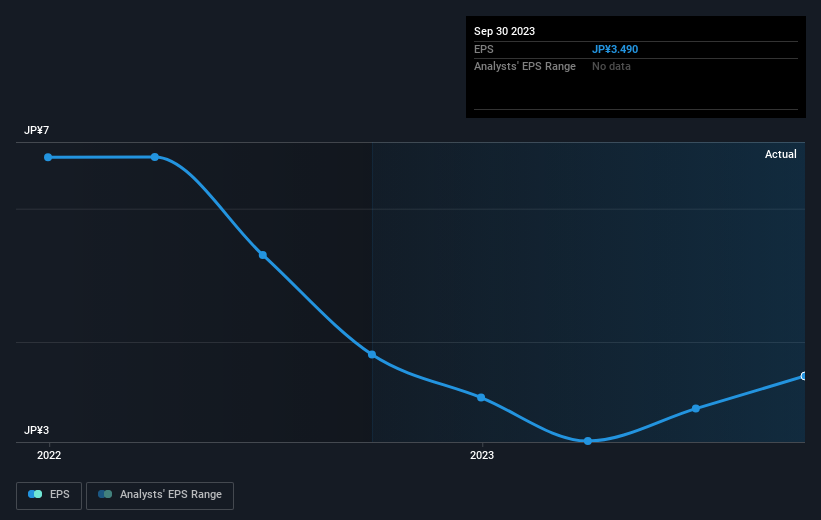
Looking back five years, both DYNAM JAPAN HOLDINGS' share price and EPS declined; the latter at a rate of 28% per year. The share price decline of 16% per year isn't as bad as the EPS decline. So the market may previously have expected a drop, or else it expects the situation will improve.
The image below shows how EPS has tracked over time (if you click on the image you can see greater detail).
It's probably worth noting we've seen significant insider buying in the last quarter, which we consider a positive. On the other hand, we think the revenue and earnings trends are much more meaningful measures of the business. Dive deeper into the earnings by checking this interactive graph of DYNAM JAPAN HOLDINGS' earnings, revenue and cash flow.
What About Dividends?
When looking at investment returns, it is important to consider the difference between total shareholder return (TSR) and share price return. Whereas the share price return only reflects the change in the share price, the TSR includes the value of dividends (assuming they were reinvested) and the benefit of any discounted capital raising or spin-off. It's fair to say that the TSR gives a more complete picture for stocks that pay a dividend. As it happens, DYNAM JAPAN HOLDINGS' TSR for the last 5 years was -42%, which exceeds the share price return mentioned earlier. The dividends paid by the company have thusly boosted the total shareholder return.
A Different Perspective
We regret to report that DYNAM JAPAN HOLDINGS shareholders are down 21% for the year (even including dividends). Unfortunately, that's worse than the broader market decline of 18%. However, it could simply be that the share price has been impacted by broader market jitters. It might be worth keeping an eye on the fundamentals, in case there's a good opportunity. Unfortunately, last year's performance may indicate unresolved challenges, given that it was worse than the annualised loss of 7% over the last half decade. Generally speaking long term share price weakness can be a bad sign, though contrarian investors might want to research the stock in hope of a turnaround. I find it very interesting to look at share price over the long term as a proxy for business performance. But to truly gain insight, we need to consider other information, too. Like risks, for instance. Every company has them, and we've spotted 4 warning signs for DYNAM JAPAN HOLDINGS (of which 3 are concerning!) you should know about.
DYNAM JAPAN HOLDINGS is not the only stock that insiders are buying. For those who like to find winning investments this free list of growing companies with recent insider purchasing, could be just the ticket.
Please note, the market returns quoted in this article reflect the market weighted average returns of stocks that currently trade on Hong Kong exchanges.
New: Manage All Your Stock Portfolios in One Place
We've created the ultimate portfolio companion for stock investors, and it's free.
• Connect an unlimited number of Portfolios and see your total in one currency
• Be alerted to new Warning Signs or Risks via email or mobile
• Track the Fair Value of your stocks
Have feedback on this article? Concerned about the content? Get in touch with us directly. Alternatively, email editorial-team (at) simplywallst.com.
This article by Simply Wall St is general in nature. We provide commentary based on historical data and analyst forecasts only using an unbiased methodology and our articles are not intended to be financial advice. It does not constitute a recommendation to buy or sell any stock, and does not take account of your objectives, or your financial situation. We aim to bring you long-term focused analysis driven by fundamental data. Note that our analysis may not factor in the latest price-sensitive company announcements or qualitative material. Simply Wall St has no position in any stocks mentioned.
About SEHK:6889
DYNAM JAPAN HOLDINGS
Dynam Japan Holdings Co., Ltd., through its subsidiaries, operates a chain of pachinko halls in Japan.
Slight with acceptable track record.
