Stella International Holdings' (HKG:1836) one-year earnings growth trails the decent shareholder returns


Passive investing in index funds can generate returns that roughly match the overall market. But one can do better than that by picking better than average stocks (as part of a diversified portfolio). To wit, the Stella International Holdings Limited (HKG:1836) share price is 80% higher than it was a year ago, much better than the market return of around 16% (not including dividends) in the same period. So that should have shareholders smiling. Looking back further, the stock price is 48% higher than it was three years ago.
After a strong gain in the past week, it's worth seeing if longer term returns have been driven by improving fundamentals.
Check out our latest analysis for Stella International Holdings
In his essay The Superinvestors of Graham-and-Doddsville Warren Buffett described how share prices do not always rationally reflect the value of a business. By comparing earnings per share (EPS) and share price changes over time, we can get a feel for how investor attitudes to a company have morphed over time.
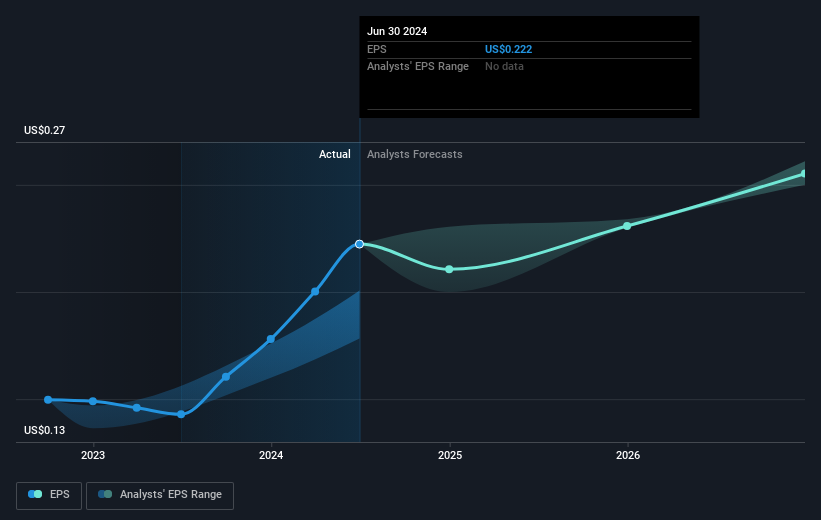
Stella International Holdings was able to grow EPS by 56% in the last twelve months. The share price gain of 80% certainly outpaced the EPS growth. So it's fair to assume the market has a higher opinion of the business than it a year ago.
You can see how EPS has changed over time in the image below (click on the chart to see the exact values).
We know that Stella International Holdings has improved its bottom line over the last three years, but what does the future have in store? Take a more thorough look at Stella International Holdings' financial health with this free report on its balance sheet.
What About Dividends?
It is important to consider the total shareholder return, as well as the share price return, for any given stock. The TSR incorporates the value of any spin-offs or discounted capital raisings, along with any dividends, based on the assumption that the dividends are reinvested. Arguably, the TSR gives a more comprehensive picture of the return generated by a stock. As it happens, Stella International Holdings' TSR for the last 1 year was 96%, which exceeds the share price return mentioned earlier. This is largely a result of its dividend payments!
A Different Perspective
It's nice to see that Stella International Holdings shareholders have received a total shareholder return of 96% over the last year. And that does include the dividend. That's better than the annualised return of 12% over half a decade, implying that the company is doing better recently. In the best case scenario, this may hint at some real business momentum, implying that now could be a great time to delve deeper. It's always interesting to track share price performance over the longer term. But to understand Stella International Holdings better, we need to consider many other factors. Take risks, for example - Stella International Holdings has 2 warning signs we think you should be aware of.
Of course Stella International Holdings may not be the best stock to buy. So you may wish to see this free collection of growth stocks.
Please note, the market returns quoted in this article reflect the market weighted average returns of stocks that currently trade on Hong Kong exchanges.
New: Manage All Your Stock Portfolios in One Place
We've created the ultimate portfolio companion for stock investors, and it's free.
• Connect an unlimited number of Portfolios and see your total in one currency
• Be alerted to new Warning Signs or Risks via email or mobile
• Track the Fair Value of your stocks
Have feedback on this article? Concerned about the content? Get in touch with us directly. Alternatively, email editorial-team (at) simplywallst.com.
This article by Simply Wall St is general in nature. We provide commentary based on historical data and analyst forecasts only using an unbiased methodology and our articles are not intended to be financial advice. It does not constitute a recommendation to buy or sell any stock, and does not take account of your objectives, or your financial situation. We aim to bring you long-term focused analysis driven by fundamental data. Note that our analysis may not factor in the latest price-sensitive company announcements or qualitative material. Simply Wall St has no position in any stocks mentioned.
About SEHK:1836
Stella International Holdings
An investment holding company, engages in development, manufacture, and sale of footwear products and leather goods in North America, the People’s Republic of China, Europe, Asia, and internationally.
Flawless balance sheet with solid track record and pays a dividend.
