Despite the downward trend in earnings at Stella International Holdings (HKG:1836) the stock grows 6.2%, bringing one-year gains to 65%


The simplest way to invest in stocks is to buy exchange traded funds. But one can do better than that by picking better than average stocks (as part of a diversified portfolio). To wit, the Stella International Holdings Limited (HKG:1836) share price is 48% higher than it was a year ago, much better than the market decline of around 10% (not including dividends) in the same period. So that should have shareholders smiling. However, the longer term returns haven't been so impressive, with the stock up just 22% in the last three years.
On the back of a solid 7-day performance, let's check what role the company's fundamentals have played in driving long term shareholder returns.
Check out our latest analysis for Stella International Holdings
To quote Buffett, 'Ships will sail around the world but the Flat Earth Society will flourish. There will continue to be wide discrepancies between price and value in the marketplace...' By comparing earnings per share (EPS) and share price changes over time, we can get a feel for how investor attitudes to a company have morphed over time.
Over the last twelve months, Stella International Holdings actually shrank its EPS by 5.0%.
Sometimes companies will sacrifice EPS in the short term for longer term gains; and in that case we may be able to find other positives. Since the change in EPS doesn't seem to correlate with the change in share price, it's worth taking a look at other metrics.
Absent any improvement, we don't think a thirst for dividends is pushing up the Stella International Holdings' share price. Revenue actually dropped 9.1% over last year. It's fair to say we're a little surprised to see the share price up, and that makes us cautious.
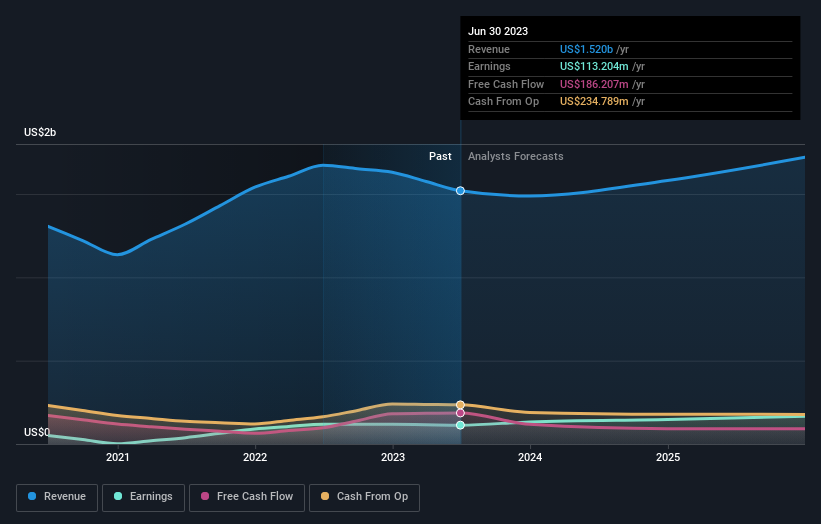
The company's revenue and earnings (over time) are depicted in the image below (click to see the exact numbers).
Take a more thorough look at Stella International Holdings' financial health with this free report on its balance sheet.
What About Dividends?
It is important to consider the total shareholder return, as well as the share price return, for any given stock. The TSR incorporates the value of any spin-offs or discounted capital raisings, along with any dividends, based on the assumption that the dividends are reinvested. It's fair to say that the TSR gives a more complete picture for stocks that pay a dividend. As it happens, Stella International Holdings' TSR for the last 1 year was 65%, which exceeds the share price return mentioned earlier. And there's no prize for guessing that the dividend payments largely explain the divergence!
A Different Perspective
We're pleased to report that Stella International Holdings shareholders have received a total shareholder return of 65% over one year. Of course, that includes the dividend. That gain is better than the annual TSR over five years, which is 7%. Therefore it seems like sentiment around the company has been positive lately. Someone with an optimistic perspective could view the recent improvement in TSR as indicating that the business itself is getting better with time. It's always interesting to track share price performance over the longer term. But to understand Stella International Holdings better, we need to consider many other factors. For instance, we've identified 2 warning signs for Stella International Holdings that you should be aware of.
If you would prefer to check out another company -- one with potentially superior financials -- then do not miss this free list of companies that have proven they can grow earnings.
Please note, the market returns quoted in this article reflect the market weighted average returns of stocks that currently trade on Hong Kong exchanges.
New: Manage All Your Stock Portfolios in One Place
We've created the ultimate portfolio companion for stock investors, and it's free.
• Connect an unlimited number of Portfolios and see your total in one currency
• Be alerted to new Warning Signs or Risks via email or mobile
• Track the Fair Value of your stocks
Have feedback on this article? Concerned about the content? Get in touch with us directly. Alternatively, email editorial-team (at) simplywallst.com.
This article by Simply Wall St is general in nature. We provide commentary based on historical data and analyst forecasts only using an unbiased methodology and our articles are not intended to be financial advice. It does not constitute a recommendation to buy or sell any stock, and does not take account of your objectives, or your financial situation. We aim to bring you long-term focused analysis driven by fundamental data. Note that our analysis may not factor in the latest price-sensitive company announcements or qualitative material. Simply Wall St has no position in any stocks mentioned.
About SEHK:1836
Stella International Holdings
An investment holding company, engages in development, manufacture, and sale of footwear products and leather goods in North America, the People’s Republic of China, Europe, Asia, and internationally.
Flawless balance sheet with solid track record and pays a dividend.
