Stock Analysis
- Greece
- /
- Personal Products
- /
- ATSE:SAR
Gr. Sarantis (ATH:SAR) stock performs better than its underlying earnings growth over last year

Passive investing in index funds can generate returns that roughly match the overall market. But if you pick the right individual stocks, you could make more than that. For example, the Gr. Sarantis S.A. (ATH:SAR) share price is up 78% in the last 1 year, clearly besting the market return of around 32% (not including dividends). If it can keep that out-performance up over the long term, investors will do very well! And shareholders have also done well over the long term, with an increase of 34% in the last three years.
Since it's been a strong week for Gr. Sarantis shareholders, let's have a look at trend of the longer term fundamentals.
See our latest analysis for Gr. Sarantis
To paraphrase Benjamin Graham: Over the short term the market is a voting machine, but over the long term it's a weighing machine. One imperfect but simple way to consider how the market perception of a company has shifted is to compare the change in the earnings per share (EPS) with the share price movement.
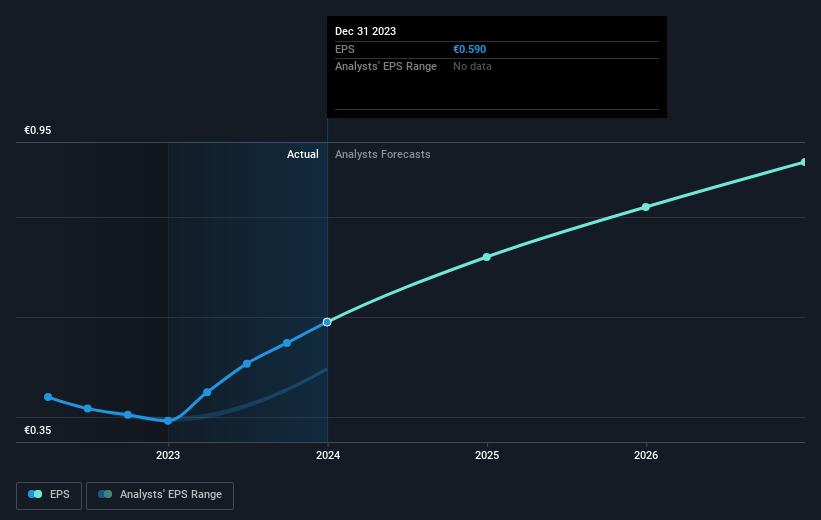
During the last year Gr. Sarantis grew its earnings per share (EPS) by 50%. This EPS growth is significantly lower than the 78% increase in the share price. This indicates that the market is now more optimistic about the stock.
The graphic below depicts how EPS has changed over time (unveil the exact values by clicking on the image).
We like that insiders have been buying shares in the last twelve months. Having said that, most people consider earnings and revenue growth trends to be a more meaningful guide to the business. Before buying or selling a stock, we always recommend a close examination of historic growth trends, available here..
What About Dividends?
When looking at investment returns, it is important to consider the difference between total shareholder return (TSR) and share price return. The TSR is a return calculation that accounts for the value of cash dividends (assuming that any dividend received was reinvested) and the calculated value of any discounted capital raisings and spin-offs. So for companies that pay a generous dividend, the TSR is often a lot higher than the share price return. We note that for Gr. Sarantis the TSR over the last 1 year was 82%, which is better than the share price return mentioned above. This is largely a result of its dividend payments!
A Different Perspective
It's nice to see that Gr. Sarantis shareholders have received a total shareholder return of 82% over the last year. And that does include the dividend. Since the one-year TSR is better than the five-year TSR (the latter coming in at 12% per year), it would seem that the stock's performance has improved in recent times. Given the share price momentum remains strong, it might be worth taking a closer look at the stock, lest you miss an opportunity. Investors who like to make money usually check up on insider purchases, such as the price paid, and total amount bought. You can find out about the insider purchases of Gr. Sarantis by clicking this link.
Gr. Sarantis is not the only stock that insiders are buying. For those who like to find winning investments this free list of growing companies with recent insider purchasing, could be just the ticket.
Please note, the market returns quoted in this article reflect the market weighted average returns of stocks that currently trade on Greek exchanges.
Valuation is complex, but we're helping make it simple.
Find out whether Gr. Sarantis is potentially over or undervalued by checking out our comprehensive analysis, which includes fair value estimates, risks and warnings, dividends, insider transactions and financial health.
View the Free AnalysisHave feedback on this article? Concerned about the content? Get in touch with us directly. Alternatively, email editorial-team (at) simplywallst.com.
This article by Simply Wall St is general in nature. We provide commentary based on historical data and analyst forecasts only using an unbiased methodology and our articles are not intended to be financial advice. It does not constitute a recommendation to buy or sell any stock, and does not take account of your objectives, or your financial situation. We aim to bring you long-term focused analysis driven by fundamental data. Note that our analysis may not factor in the latest price-sensitive company announcements or qualitative material. Simply Wall St has no position in any stocks mentioned.
About ATSE:SAR
Gr. Sarantis
Gr. Sarantis S.A., together with its subsidiaries, produces and trades cosmetics, household, and parapharmaceutical products.
Flawless balance sheet with proven track record.

