Stock Analysis
- Greece
- /
- Oil and Gas
- /
- ATSE:REVOIL
The 10% return this week takes Revoil's (ATH:REVOIL) shareholders five-year gains to 347%


Buying shares in the best businesses can build meaningful wealth for you and your family. While the best companies are hard to find, but they can generate massive returns over long periods. To wit, the Revoil S.A. (ATH:REVOIL) share price has soared 332% over five years. And this is just one example of the epic gains achieved by some long term investors. Also pleasing for shareholders was the 55% gain in the last three months.
Since it's been a strong week for Revoil shareholders, let's have a look at trend of the longer term fundamentals.
View our latest analysis for Revoil
To paraphrase Benjamin Graham: Over the short term the market is a voting machine, but over the long term it's a weighing machine. One flawed but reasonable way to assess how sentiment around a company has changed is to compare the earnings per share (EPS) with the share price.
During the five years of share price growth, Revoil moved from a loss to profitability. That kind of transition can be an inflection point that justifies a strong share price gain, just as we have seen here. Given that the company made a profit three years ago, but not five years ago, it is worth looking at the share price returns over the last three years, too. We can see that the Revoil share price is up 255% in the last three years. During the same period, EPS grew by 24% each year. This EPS growth is lower than the 53% average annual increase in the share price over three years. So one can reasonably conclude the market is more enthusiastic about the stock than it was three years ago.
You can see below how EPS has changed over time (discover the exact values by clicking on the image).
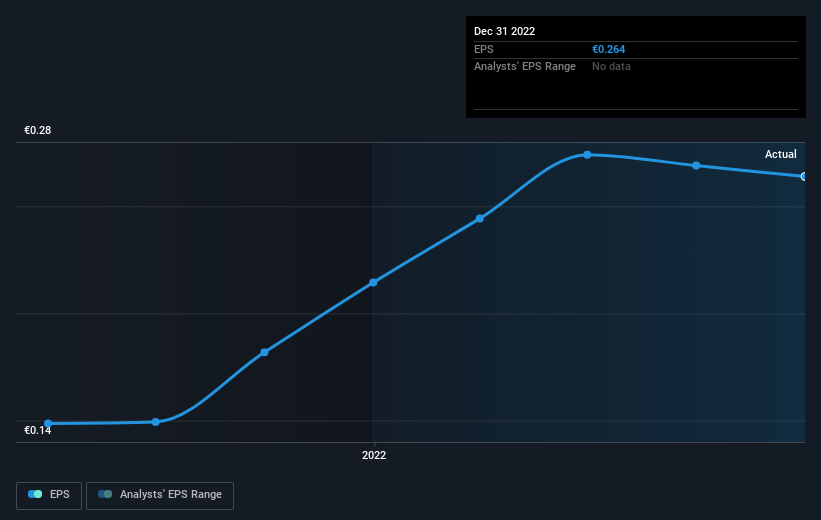
It might be well worthwhile taking a look at our free report on Revoil's earnings, revenue and cash flow.
What About Dividends?
It is important to consider the total shareholder return, as well as the share price return, for any given stock. The TSR incorporates the value of any spin-offs or discounted capital raisings, along with any dividends, based on the assumption that the dividends are reinvested. It's fair to say that the TSR gives a more complete picture for stocks that pay a dividend. In the case of Revoil, it has a TSR of 347% for the last 5 years. That exceeds its share price return that we previously mentioned. And there's no prize for guessing that the dividend payments largely explain the divergence!
A Different Perspective
It's good to see that Revoil has rewarded shareholders with a total shareholder return of 83% in the last twelve months. Of course, that includes the dividend. That gain is better than the annual TSR over five years, which is 35%. Therefore it seems like sentiment around the company has been positive lately. In the best case scenario, this may hint at some real business momentum, implying that now could be a great time to delve deeper. I find it very interesting to look at share price over the long term as a proxy for business performance. But to truly gain insight, we need to consider other information, too. Case in point: We've spotted 2 warning signs for Revoil you should be aware of.
But note: Revoil may not be the best stock to buy. So take a peek at this free list of interesting companies with past earnings growth (and further growth forecast).
Please note, the market returns quoted in this article reflect the market weighted average returns of stocks that currently trade on Greek exchanges.
Valuation is complex, but we're helping make it simple.
Find out whether Revoil is potentially over or undervalued by checking out our comprehensive analysis, which includes fair value estimates, risks and warnings, dividends, insider transactions and financial health.
View the Free AnalysisHave feedback on this article? Concerned about the content? Get in touch with us directly. Alternatively, email editorial-team (at) simplywallst.com.
This article by Simply Wall St is general in nature. We provide commentary based on historical data and analyst forecasts only using an unbiased methodology and our articles are not intended to be financial advice. It does not constitute a recommendation to buy or sell any stock, and does not take account of your objectives, or your financial situation. We aim to bring you long-term focused analysis driven by fundamental data. Note that our analysis may not factor in the latest price-sensitive company announcements or qualitative material. Simply Wall St has no position in any stocks mentioned.
About ATSE:REVOIL
Revoil
Engages in the trading and marketing of petroleum products for use in automobiles, homes, and vessels in Greece.
Medium with questionable track record.
