Stock Analysis
Declining Stock and Solid Fundamentals: Is The Market Wrong About NEXT plc (LON:NXT)?


With its stock down 4.5% over the past three months, it is easy to disregard NEXT (LON:NXT). However, stock prices are usually driven by a company’s financial performance over the long term, which in this case looks quite promising. Particularly, we will be paying attention to NEXT's ROE today.
ROE or return on equity is a useful tool to assess how effectively a company can generate returns on the investment it received from its shareholders. Put another way, it reveals the company's success at turning shareholder investments into profits.
See our latest analysis for NEXT
How Do You Calculate Return On Equity?
The formula for return on equity is:
Return on Equity = Net Profit (from continuing operations) ÷ Shareholders' Equity
So, based on the above formula, the ROE for NEXT is:
49% = UK£801m ÷ UK£1.6b (Based on the trailing twelve months to January 2024).
The 'return' refers to a company's earnings over the last year. Another way to think of that is that for every £1 worth of equity, the company was able to earn £0.49 in profit.
What Is The Relationship Between ROE And Earnings Growth?
So far, we've learned that ROE is a measure of a company's profitability. Based on how much of its profits the company chooses to reinvest or "retain", we are then able to evaluate a company's future ability to generate profits. Assuming all else is equal, companies that have both a higher return on equity and higher profit retention are usually the ones that have a higher growth rate when compared to companies that don't have the same features.
NEXT's Earnings Growth And 49% ROE
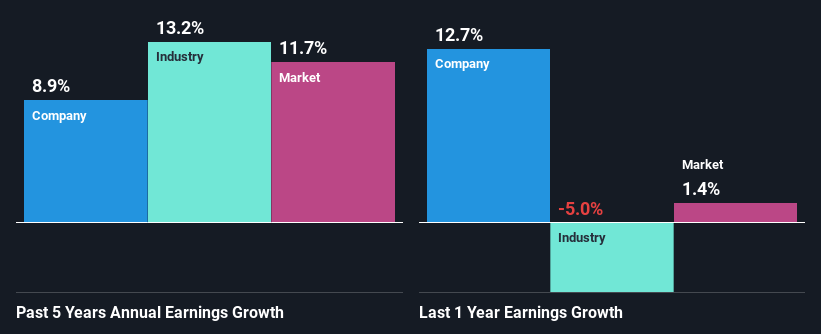
Firstly, we acknowledge that NEXT has a significantly high ROE. Second, a comparison with the average ROE reported by the industry of 17% also doesn't go unnoticed by us. This probably laid the groundwork for NEXT's moderate 8.9% net income growth seen over the past five years.
We then compared NEXT's net income growth with the industry and found that the company's growth figure is lower than the average industry growth rate of 13% in the same 5-year period, which is a bit concerning.
The basis for attaching value to a company is, to a great extent, tied to its earnings growth. It’s important for an investor to know whether the market has priced in the company's expected earnings growth (or decline). By doing so, they will have an idea if the stock is headed into clear blue waters or if swampy waters await. What is NXT worth today? The intrinsic value infographic in our free research report helps visualize whether NXT is currently mispriced by the market.
Is NEXT Using Its Retained Earnings Effectively?
NEXT has a three-year median payout ratio of 34%, which implies that it retains the remaining 66% of its profits. This suggests that its dividend is well covered, and given the decent growth seen by the company, it looks like management is reinvesting its earnings efficiently.
Moreover, NEXT is determined to keep sharing its profits with shareholders which we infer from its long history of paying a dividend for at least ten years. Based on the latest analysts' estimates, we found that the company's future payout ratio over the next three years is expected to hold steady at 36%. However, NEXT's future ROE is expected to decline to 37% despite there being not much change anticipated in the company's payout ratio.
Conclusion
In total, we are pretty happy with NEXT's performance. Specifically, we like that the company is reinvesting a huge chunk of its profits at a high rate of return. This of course has caused the company to see a good amount of growth in its earnings. Having said that, the company's earnings growth is expected to slow down, as forecasted in the current analyst estimates. To know more about the latest analysts predictions for the company, check out this visualization of analyst forecasts for the company.
Valuation is complex, but we're helping make it simple.
Find out whether NEXT is potentially over or undervalued by checking out our comprehensive analysis, which includes fair value estimates, risks and warnings, dividends, insider transactions and financial health.
View the Free AnalysisHave feedback on this article? Concerned about the content? Get in touch with us directly. Alternatively, email editorial-team (at) simplywallst.com.
This article by Simply Wall St is general in nature. We provide commentary based on historical data and analyst forecasts only using an unbiased methodology and our articles are not intended to be financial advice. It does not constitute a recommendation to buy or sell any stock, and does not take account of your objectives, or your financial situation. We aim to bring you long-term focused analysis driven by fundamental data. Note that our analysis may not factor in the latest price-sensitive company announcements or qualitative material. Simply Wall St has no position in any stocks mentioned.
Valuation is complex, but we're helping make it simple.
Find out whether NEXT is potentially over or undervalued by checking out our comprehensive analysis, which includes fair value estimates, risks and warnings, dividends, insider transactions and financial health.
View the Free AnalysisHave feedback on this article? Concerned about the content? Get in touch with us directly. Alternatively, email editorial-team@simplywallst.com
About LSE:NXT
NEXT
Engages in the retail of clothing, beauty, footwear, and home products in the United Kingdom, rest of Europe, the Middle East, Asia, and internationally.
Outstanding track record with excellent balance sheet and pays a dividend.
