Stock Analysis
- United Kingdom
- /
- REITS
- /
- LSE:SERE
Recent 11% pullback isn't enough to hurt long-term Schroder European Real Estate Investment Trust (LON:SERE) shareholders, they're still up 7.3% over 5 years

In order to justify the effort of selecting individual stocks, it's worth striving to beat the returns from a market index fund. But even the best stock picker will only win with some selections. So we wouldn't blame long term Schroder European Real Estate Investment Trust Plc (LON:SERE) shareholders for doubting their decision to hold, with the stock down 26% over a half decade. The last week also saw the share price slip down another 11%.
After losing 11% this past week, it's worth investigating the company's fundamentals to see what we can infer from past performance.
Check out our latest analysis for Schroder European Real Estate Investment Trust
To quote Buffett, 'Ships will sail around the world but the Flat Earth Society will flourish. There will continue to be wide discrepancies between price and value in the marketplace...' One imperfect but simple way to consider how the market perception of a company has shifted is to compare the change in the earnings per share (EPS) with the share price movement.
Over five years Schroder European Real Estate Investment Trust's earnings per share dropped significantly, falling to a loss, with the share price also lower. The recent extraordinary items contributed to this situation. Since the company has fallen to a loss making position, it's hard to compare the change in EPS with the share price change. But we would generally expect a lower price, given the situation.
The graphic below depicts how EPS has changed over time (unveil the exact values by clicking on the image).
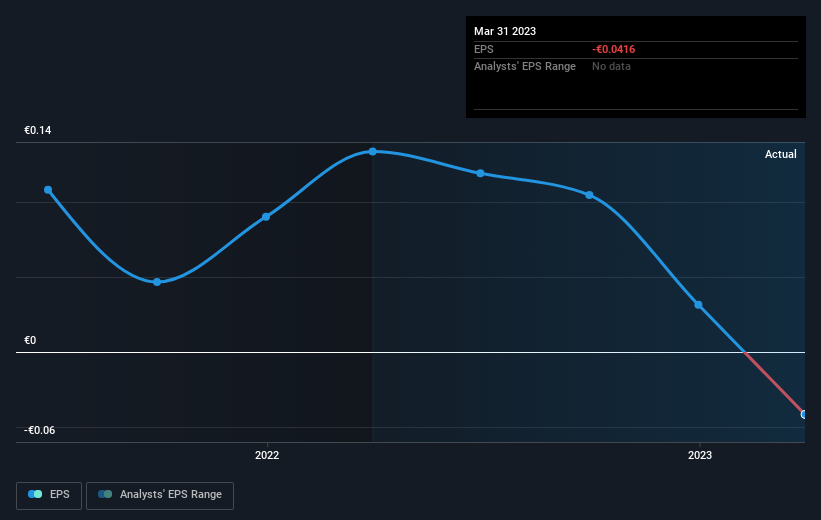
Dive deeper into Schroder European Real Estate Investment Trust's key metrics by checking this interactive graph of Schroder European Real Estate Investment Trust's earnings, revenue and cash flow.
What About Dividends?
As well as measuring the share price return, investors should also consider the total shareholder return (TSR). The TSR is a return calculation that accounts for the value of cash dividends (assuming that any dividend received was reinvested) and the calculated value of any discounted capital raisings and spin-offs. It's fair to say that the TSR gives a more complete picture for stocks that pay a dividend. We note that for Schroder European Real Estate Investment Trust the TSR over the last 5 years was 7.3%, which is better than the share price return mentioned above. And there's no prize for guessing that the dividend payments largely explain the divergence!
A Different Perspective
Schroder European Real Estate Investment Trust shareholders are down 14% for the year (even including dividends), but the market itself is up 6.6%. However, keep in mind that even the best stocks will sometimes underperform the market over a twelve month period. Longer term investors wouldn't be so upset, since they would have made 1.4%, each year, over five years. If the fundamental data continues to indicate long term sustainable growth, the current sell-off could be an opportunity worth considering. While it is well worth considering the different impacts that market conditions can have on the share price, there are other factors that are even more important. Like risks, for instance. Every company has them, and we've spotted 2 warning signs for Schroder European Real Estate Investment Trust (of which 1 is a bit concerning!) you should know about.
But note: Schroder European Real Estate Investment Trust may not be the best stock to buy. So take a peek at this free list of interesting companies with past earnings growth (and further growth forecast).
Please note, the market returns quoted in this article reflect the market weighted average returns of stocks that currently trade on British exchanges.
Valuation is complex, but we're helping make it simple.
Find out whether Schroder European Real Estate Investment Trust is potentially over or undervalued by checking out our comprehensive analysis, which includes fair value estimates, risks and warnings, dividends, insider transactions and financial health.
View the Free AnalysisHave feedback on this article? Concerned about the content? Get in touch with us directly. Alternatively, email editorial-team (at) simplywallst.com.
This article by Simply Wall St is general in nature. We provide commentary based on historical data and analyst forecasts only using an unbiased methodology and our articles are not intended to be financial advice. It does not constitute a recommendation to buy or sell any stock, and does not take account of your objectives, or your financial situation. We aim to bring you long-term focused analysis driven by fundamental data. Note that our analysis may not factor in the latest price-sensitive company announcements or qualitative material. Simply Wall St has no position in any stocks mentioned.
About LSE:SERE
Schroder European Real Estate Investment Trust
SEREIT invests in European growth cities and regions.
Good value with adequate balance sheet and pays a dividend.

