Stock Analysis
- United Kingdom
- /
- Media
- /
- AIM:NEXN
Exploring GB Group And 2 Other High Growth Tech Stocks

Reviewed by Simply Wall St
The UK market has recently faced headwinds, with the FTSE 100 closing lower amid weak trade data from China, which has impacted companies closely tied to its economic fortunes. In this challenging environment, identifying high-growth tech stocks like GB Group and two others can offer potential opportunities for investors seeking resilience and innovation in their portfolios.
Top 10 High Growth Tech Companies In The United Kingdom
| Name | Revenue Growth | Earnings Growth | Growth Rating |
|---|---|---|---|
| Filtronic | 21.64% | 33.46% | ★★★★★★ |
| YouGov | 14.30% | 29.79% | ★★★★★☆ |
| Facilities by ADF | 32.33% | 94.46% | ★★★★★★ |
| STV Group | 13.43% | 47.09% | ★★★★★☆ |
| Trustpilot Group | 16.23% | 31.98% | ★★★★★☆ |
| Redcentric | 4.89% | 63.79% | ★★★★★☆ |
| LungLife AI | 100.61% | 100.97% | ★★★★★☆ |
| IQGeo Group | 11.49% | 63.61% | ★★★★★☆ |
| Beeks Financial Cloud Group | 24.63% | 57.95% | ★★★★★☆ |
| Seeing Machines | 23.98% | 93.74% | ★★★★★☆ |
Click here to see the full list of 50 stocks from our UK High Growth Tech and AI Stocks screener.
Here's a peek at a few of the choices from the screener.
GB Group (AIM:GBG)
Simply Wall St Growth Rating: ★★★★☆☆
Overview: GB Group plc, with a market cap of £854.61 million, provides identity data intelligence products and services in the United Kingdom, the United States, Australia, and internationally.
Operations: GB Group plc generates revenue through three primary segments: Fraud (£40.20 million), Identity (£156.06 million), and Location (£81.07 million). The company operates across various regions, including the UK, US, Australia, and other international markets.
GB Group's revenue is forecast to grow at 6.8% annually, outpacing the UK market's 3.7%. Despite being unprofitable, earnings are expected to surge by 92.89% per year, with profitability anticipated within three years. The company declared a final dividend of £0.042 per share for FY24, amounting to £10.6 million, reflecting a slight increase from the previous year's £10.1 million payout. R&D expenditure remains pivotal for GB Group’s innovation and long-term growth trajectory in the tech sector.
- Dive into the specifics of GB Group here with our thorough health report.
Assess GB Group's past performance with our detailed historical performance reports.

Nexxen International (AIM:NEXN)
Simply Wall St Growth Rating: ★★★★☆☆
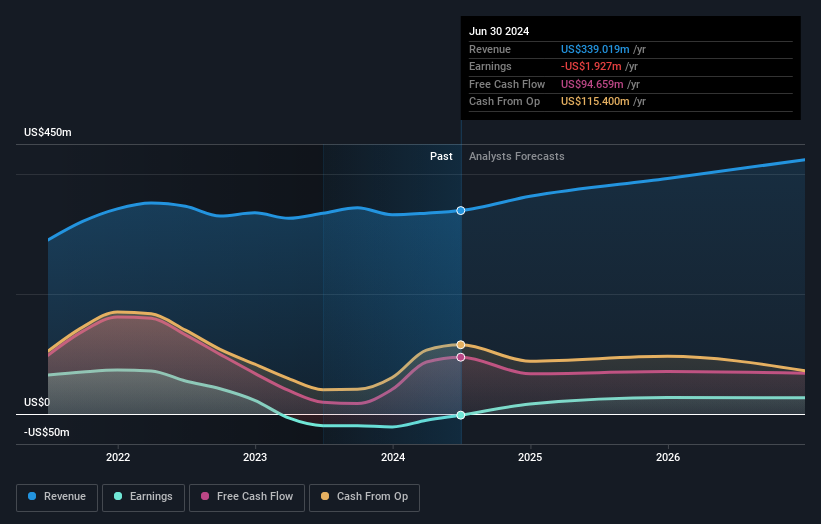
Overview: Nexxen International Ltd. offers a comprehensive software platform for advertisers to connect with publishers in Israel, with a market cap of £410.46 million.
Operations: Nexxen International Ltd. generates revenue primarily through its marketing services, amounting to $339.02 million. The company focuses on enabling advertisers to effectively reach publishers in Israel using its end-to-end software platform.
Nexxen International's recent earnings report highlights a significant turnaround, with Q2 sales at $88.58 million, up from $84.25 million last year, and net income of $2.92 million compared to a net loss of $5.61 million previously. The company’s strategic data partnership with The Trade Desk enhances cross-channel targeting capabilities using Nexxen's unique ACR data segments, addressing key advertising challenges in CTV. R&D expenses have been pivotal, supporting innovations that drive their 8.8% annual revenue growth forecast and anticipated profitability within three years.
Informa (LSE:INF)
Simply Wall St Growth Rating: ★★★★☆☆
Overview: Informa plc is an international company specializing in events, digital services, and academic research with operations in the United Kingdom, Continental Europe, the United States, China, and other global markets; it has a market cap of £10.90 billion.
Operations: Informa generates revenue through four primary segments: Informa Tech (£426.70 million), Informa Connect (£630.20 million), Informa Markets (£1.67 billion), and Taylor & Francis (£636.70 million). The company operates across various global markets, including the UK, Continental Europe, the US, and China.
Informa’s recent financial performance shows a mixed picture, with half-year sales reaching £1.70 billion, up from £1.52 billion last year, yet net income fell to £147.3 million from £253.5 million previously. The company repurchased 41.67 million shares for £338.9 million in the first half of 2024, reflecting a strategic focus on shareholder value despite earnings volatility. Informa's R&D expenses have supported innovation within its events and digital services segments, contributing to a forecasted annual revenue growth of 6.7%.
- Unlock comprehensive insights into our analysis of Informa stock in this health report.
Explore historical data to track Informa's performance over time in our Past section.

Taking Advantage
- Click this link to deep-dive into the 50 companies within our UK High Growth Tech and AI Stocks screener.
- Are these companies part of your investment strategy? Use Simply Wall St to consolidate your holdings into a portfolio and gain insights with our comprehensive analysis tools.
- Unlock the power of informed investing with Simply Wall St, your free guide to navigating stock markets worldwide.
Interested In Other Possibilities?
- Explore high-performing small cap companies that haven't yet garnered significant analyst attention.
- Fuel your portfolio with companies showing strong growth potential, backed by optimistic outlooks both from analysts and management.
- Find companies with promising cash flow potential yet trading below their fair value.
This article by Simply Wall St is general in nature. We provide commentary based on historical data and analyst forecasts only using an unbiased methodology and our articles are not intended to be financial advice. It does not constitute a recommendation to buy or sell any stock, and does not take account of your objectives, or your financial situation. We aim to bring you long-term focused analysis driven by fundamental data. Note that our analysis may not factor in the latest price-sensitive company announcements or qualitative material. Simply Wall St has no position in any stocks mentioned.
Valuation is complex, but we're here to simplify it.
Discover if Nexxen International might be undervalued or overvalued with our detailed analysis, featuring fair value estimates, potential risks, dividends, insider trades, and its financial condition.
Access Free AnalysisHave feedback on this article? Concerned about the content? Get in touch with us directly. Alternatively, email editorial-team@simplywallst.com
About AIM:NEXN
Nexxen International
Provides end-to-end software platform that enables advertisers to reach publishers Israel.
