Stock Analysis
- United Kingdom
- /
- Media
- /
- AIM:NEXN
Exploring GB Group And 2 Other High Growth Tech Stocks In The UK

Reviewed by Simply Wall St
The United Kingdom's FTSE 100 index recently closed lower, impacted by weak trade data from China, which has shown a significant contraction in both exports and imports. In this challenging market environment, identifying high-growth tech stocks becomes crucial for investors seeking robust opportunities; in this article, we will explore GB Group and two other promising tech companies in the UK.
Top 10 High Growth Tech Companies In The United Kingdom
| Name | Revenue Growth | Earnings Growth | Growth Rating |
|---|---|---|---|
| Filtronic | 21.64% | 33.46% | ★★★★★★ |
| YouGov | 14.30% | 29.79% | ★★★★★☆ |
| Facilities by ADF | 32.33% | 94.46% | ★★★★★★ |
| STV Group | 13.43% | 47.09% | ★★★★★☆ |
| Trustpilot Group | 16.23% | 31.98% | ★★★★★☆ |
| Redcentric | 4.89% | 63.79% | ★★★★★☆ |
| LungLife AI | 100.61% | 100.97% | ★★★★★☆ |
| IQGeo Group | 11.49% | 63.61% | ★★★★★☆ |
| Beeks Financial Cloud Group | 24.63% | 57.95% | ★★★★★☆ |
| Seeing Machines | 23.98% | 93.74% | ★★★★★☆ |
Click here to see the full list of 50 stocks from our UK High Growth Tech and AI Stocks screener.
Let's explore several standout options from the results in the screener.
GB Group (AIM:GBG)
Simply Wall St Growth Rating: ★★★★☆☆
Overview: GB Group plc, along with its subsidiaries, offers identity data intelligence products and services across the United Kingdom, the United States, Australia, and other international markets, with a market cap of £854.61 million.
Operations: GB Group plc generates revenue through three primary segments: Fraud (£40.20 million), Identity (£156.06 million), and Location (£81.07 million). The company operates in various international markets, including the United Kingdom, the United States, and Australia.
GB Group's revenue is forecast to grow at 6.8% annually, outpacing the UK market's 3.7% growth rate. Despite a net loss of £48.58 million for the year ending March 31, 2024, earnings are expected to surge by 92.89% per year over the next three years, indicating a positive turnaround trajectory. The company has also invested significantly in R&D, with expenses reflecting their commitment to innovation and operational efficiency gains achieved in FY24 driving high single-digit growth in adjusted operating profit for FY25.
- Unlock comprehensive insights into our analysis of GB Group stock in this health report.
Evaluate GB Group's historical performance by accessing our past performance report.

Nexxen International (AIM:NEXN)
Simply Wall St Growth Rating: ★★★★☆☆
Overview: Nexxen International Ltd. offers a comprehensive software platform for advertisers to connect with publishers in Israel and has a market cap of £410.46 million.
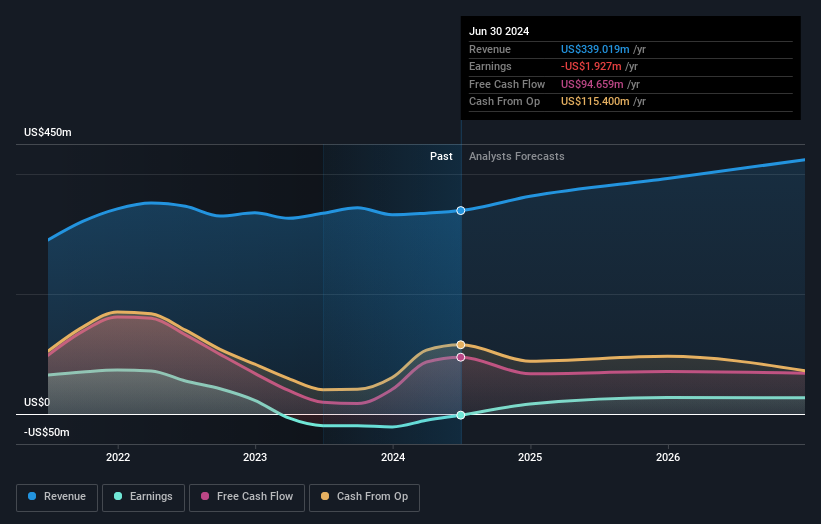
Operations: Nexxen International Ltd. generates revenue primarily through its marketing services, amounting to $339.02 million. The company focuses on providing an end-to-end software platform for advertisers to engage with publishers in Israel.
Nexxen International's revenue is forecast to grow at 8.8% annually, outpacing the UK's market rate of 3.7%. The company recently reported second-quarter sales of $88.58 million, up from $84.25 million a year ago, and a net income of $2.92 million compared to a net loss of $5.61 million previously. Strategic partnerships with The Trade Desk and Vevo enhance Nexxen's programmatic footprint and data capabilities, crucial for targeting TV-viewing audiences more effectively across multiple channels. Investing heavily in R&D, Nexxen allocates significant resources to innovation; their expenses reflect this commitment with an increase in spending by 71.9%. This focus on advanced technology development positions them well within the competitive landscape of tech firms moving towards SaaS models for recurring revenue streams from subscriptions. Future growth prospects look promising as they continue leveraging unique data segments and expanding their client base globally.
- Get an in-depth perspective on Nexxen International's performance by reading our health report here.
Gain insights into Nexxen International's past trends and performance with our Past report.
Informa (LSE:INF)
Simply Wall St Growth Rating: ★★★★☆☆
Overview: Informa plc operates as an international events, digital services, and academic research company in the United Kingdom, Continental Europe, the United States, China, and internationally with a market cap of £10.90 billion.
Operations: Informa generates revenue through four main segments: Informa Tech (£426.70 million), Informa Connect (£630.20 million), Informa Markets (£1.67 billion), and Taylor & Francis (£636.70 million). The company's diverse portfolio includes international events, digital services, and academic research, catering to various global markets including the UK, Europe, the US, and China.
Informa's revenue is forecasted to grow at 6.7% annually, surpassing the UK's market average of 3.7%. Despite a one-off loss of £213.5 million impacting recent financial results, earnings are expected to rise by 21.5% per year over the next three years, outpacing the UK market's growth rate of 14.3%. The company has repurchased 41.67 million shares for £338.9 million in H1 2024, enhancing shareholder value and confidence in its strategic direction. Informa's R&D expenses have shown a significant commitment to innovation, with investments aimed at bolstering their tech and AI capabilities within their media and events segments—crucial for staying competitive in an evolving industry landscape where digital transformation is key. This focus on advanced technology development positions them well as they continue leveraging unique data segments and expanding their client base globally through strategic partnerships and acquisitions.
- Dive into the specifics of Informa here with our thorough health report.
Gain insights into Informa's historical performance by reviewing our past performance report.

Summing It All Up
- Navigate through the entire inventory of 50 UK High Growth Tech and AI Stocks here.
- Shareholder in one or more of these companies? Ensure you're never caught off-guard by adding your portfolio in Simply Wall St for timely alerts on significant stock developments.
- Discover a world of investment opportunities with Simply Wall St's free app and access unparalleled stock analysis across all markets.
Searching for a Fresh Perspective?
- Explore high-performing small cap companies that haven't yet garnered significant analyst attention.
- Fuel your portfolio with companies showing strong growth potential, backed by optimistic outlooks both from analysts and management.
- Find companies with promising cash flow potential yet trading below their fair value.
This article by Simply Wall St is general in nature. We provide commentary based on historical data and analyst forecasts only using an unbiased methodology and our articles are not intended to be financial advice. It does not constitute a recommendation to buy or sell any stock, and does not take account of your objectives, or your financial situation. We aim to bring you long-term focused analysis driven by fundamental data. Note that our analysis may not factor in the latest price-sensitive company announcements or qualitative material. Simply Wall St has no position in any stocks mentioned.
Valuation is complex, but we're here to simplify it.
Discover if Nexxen International might be undervalued or overvalued with our detailed analysis, featuring fair value estimates, potential risks, dividends, insider trades, and its financial condition.
Access Free AnalysisHave feedback on this article? Concerned about the content? Get in touch with us directly. Alternatively, email editorial-team@simplywallst.com
About AIM:NEXN
Nexxen International
Provides end-to-end software platform that enables advertisers to reach publishers Israel.
