
Advertisement
Some say volatility, rather than debt, is the best way to think about risk as an investor, but Warren Buffett famously said that 'Volatility is far from synonymous with risk.' It's only natural to consider a company's balance sheet when you examine how risky it is, since debt is often involved when a business collapses. Importantly, i3 Energy Plc (LON:I3E) does carry debt. But the more important question is: how much risk is that debt creating?
When Is Debt A Problem?
Generally speaking, debt only becomes a real problem when a company can't easily pay it off, either by raising capital or with its own cash flow. If things get really bad, the lenders can take control of the business. However, a more frequent (but still costly) occurrence is where a company must issue shares at bargain-basement prices, permanently diluting shareholders, just to shore up its balance sheet. Having said that, the most common situation is where a company manages its debt reasonably well - and to its own advantage. When we examine debt levels, we first consider both cash and debt levels, together.
View our latest analysis for i3 Energy
What Is i3 Energy's Debt?
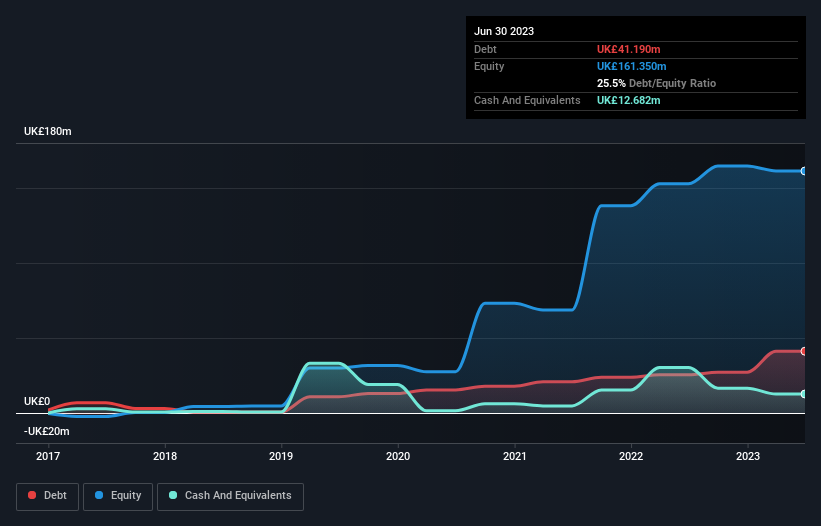
The image below, which you can click on for greater detail, shows that at June 2023 i3 Energy had debt of UK£41.2m, up from UK£25.5m in one year. However, it also had UK£12.7m in cash, and so its net debt is UK£28.5m.
How Strong Is i3 Energy's Balance Sheet?
The latest balance sheet data shows that i3 Energy had liabilities of UK£44.2m due within a year, and liabilities of UK£118.9m falling due after that. Offsetting this, it had UK£12.7m in cash and UK£20.1m in receivables that were due within 12 months. So its liabilities total UK£130.3m more than the combination of its cash and short-term receivables.
This deficit is considerable relative to its market capitalization of UK£173.8m, so it does suggest shareholders should keep an eye on i3 Energy's use of debt. Should its lenders demand that it shore up the balance sheet, shareholders would likely face severe dilution.
We measure a company's debt load relative to its earnings power by looking at its net debt divided by its earnings before interest, tax, depreciation, and amortization (EBITDA) and by calculating how easily its earnings before interest and tax (EBIT) cover its interest expense (interest cover). Thus we consider debt relative to earnings both with and without depreciation and amortization expenses.
i3 Energy has net debt of just 0.32 times EBITDA, indicating that it is certainly not a reckless borrower. And this view is supported by the solid interest coverage, with EBIT coming in at 9.3 times the interest expense over the last year. On the other hand, i3 Energy's EBIT dived 10%, over the last year. We think hat kind of performance, if repeated frequently, could well lead to difficulties for the stock. When analysing debt levels, the balance sheet is the obvious place to start. But it is future earnings, more than anything, that will determine i3 Energy's ability to maintain a healthy balance sheet going forward. So if you're focused on the future you can check out this free report showing analyst profit forecasts.
Finally, a business needs free cash flow to pay off debt; accounting profits just don't cut it. So we always check how much of that EBIT is translated into free cash flow. In the last two years, i3 Energy's free cash flow amounted to 27% of its EBIT, less than we'd expect. That weak cash conversion makes it more difficult to handle indebtedness.
Our View
While i3 Energy's EBIT growth rate does give us pause, its net debt to EBITDA and interest cover suggest it can stay on top of its debt load. When we consider all the factors discussed, it seems to us that i3 Energy is taking some risks with its use of debt. While that debt can boost returns, we think the company has enough leverage now. When analysing debt levels, the balance sheet is the obvious place to start. But ultimately, every company can contain risks that exist outside of the balance sheet. To that end, you should learn about the 3 warning signs we've spotted with i3 Energy (including 1 which shouldn't be ignored) .
If you're interested in investing in businesses that can grow profits without the burden of debt, then check out this free list of growing businesses that have net cash on the balance sheet.
Valuation is complex, but we're here to simplify it.
Discover if i3 Energy might be undervalued or overvalued with our detailed analysis, featuring fair value estimates, potential risks, dividends, insider trades, and its financial condition.
Access Free AnalysisHave feedback on this article? Concerned about the content? Get in touch with us directly. Alternatively, email editorial-team (at) simplywallst.com.
This article by Simply Wall St is general in nature. We provide commentary based on historical data and analyst forecasts only using an unbiased methodology and our articles are not intended to be financial advice. It does not constitute a recommendation to buy or sell any stock, and does not take account of your objectives, or your financial situation. We aim to bring you long-term focused analysis driven by fundamental data. Note that our analysis may not factor in the latest price-sensitive company announcements or qualitative material. Simply Wall St has no position in any stocks mentioned.
About AIM:I3E
i3 Energy
A holding company, engages in the acquisition, development, and production of oil and gas assets in the United Kingdom and Canada.
Excellent balance sheet with reasonable growth potential.
Market Insights

Advertisement
Community Narratives
The company that turned a verb into a global necessity and basically runs the modern internet, digital ads, smartphones, maps, and AI.
Fair Value US$300.00|7.1% undervalued
OS
Community Contributor
Flowers Foods Pays A Fair Price For Health
Fair Value US$16.12|26.4% undervalued
NV
Community Contributor
TMX Group will thrive with 33.3% profit margin and enduring market moat
Fair Value CA$49.90|0.8% overvalued
LI
Community Contributor
The "Molecular Pencil": Why Beam's Technology is Built to Win
Fair Value US$65.01|65.8% undervalued
DA
Community Contributor