Stock Analysis
- United Kingdom
- /
- Capital Markets
- /
- LSE:CLIG
Shareholders 15% loss in City of London Investment Group (LON:CLIG) partly attributable to the company's decline in earnings over past year


City of London Investment Group Plc (LON:CLIG) shareholders should be happy to see the share price up 10% in the last week. But in truth the last year hasn't been good for the share price. In fact the stock is down 21% in the last year, well below the market return.
While the last year has been tough for City of London Investment Group shareholders, this past week has shown signs of promise. So let's look at the longer term fundamentals and see if they've been the driver of the negative returns.
Check out our latest analysis for City of London Investment Group
To paraphrase Benjamin Graham: Over the short term the market is a voting machine, but over the long term it's a weighing machine. By comparing earnings per share (EPS) and share price changes over time, we can get a feel for how investor attitudes to a company have morphed over time.
Unfortunately City of London Investment Group reported an EPS drop of 18% for the last year. This proportional reduction in earnings per share isn't far from the 21% decrease in the share price. Given the lower EPS we might have expected investors to lose confidence in the stock, but that doesn't seemed to have happened. Rather, the share price has approximately tracked EPS growth.
You can see below how EPS has changed over time (discover the exact values by clicking on the image).
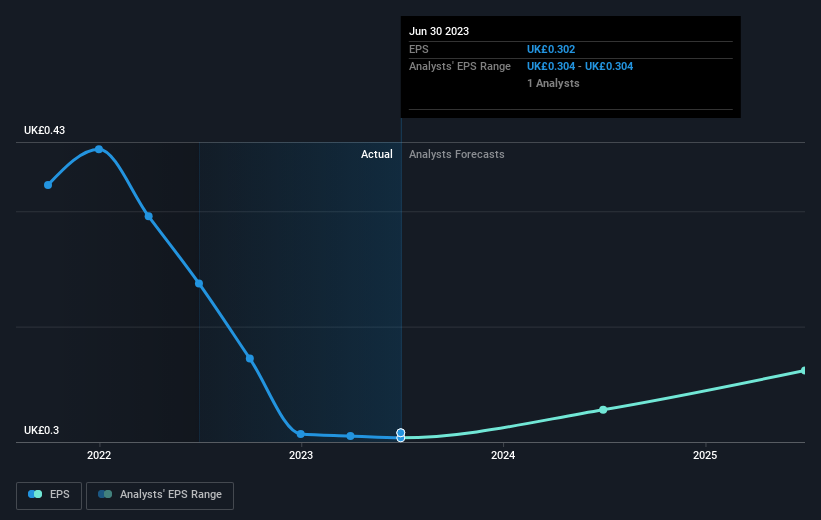
Dive deeper into City of London Investment Group's key metrics by checking this interactive graph of City of London Investment Group's earnings, revenue and cash flow.
What About Dividends?
When looking at investment returns, it is important to consider the difference between total shareholder return (TSR) and share price return. The TSR is a return calculation that accounts for the value of cash dividends (assuming that any dividend received was reinvested) and the calculated value of any discounted capital raisings and spin-offs. It's fair to say that the TSR gives a more complete picture for stocks that pay a dividend. We note that for City of London Investment Group the TSR over the last 1 year was -15%, which is better than the share price return mentioned above. And there's no prize for guessing that the dividend payments largely explain the divergence!
A Different Perspective
City of London Investment Group shareholders are down 15% for the year (even including dividends), but the market itself is up 1.4%. Even the share prices of good stocks drop sometimes, but we want to see improvements in the fundamental metrics of a business, before getting too interested. On the bright side, long term shareholders have made money, with a gain of 6% per year over half a decade. If the fundamental data continues to indicate long term sustainable growth, the current sell-off could be an opportunity worth considering. It's always interesting to track share price performance over the longer term. But to understand City of London Investment Group better, we need to consider many other factors. Even so, be aware that City of London Investment Group is showing 2 warning signs in our investment analysis , and 1 of those is significant...
If you like to buy stocks alongside management, then you might just love this free list of companies. (Hint: insiders have been buying them).
Please note, the market returns quoted in this article reflect the market weighted average returns of stocks that currently trade on British exchanges.
Valuation is complex, but we're helping make it simple.
Find out whether City of London Investment Group is potentially over or undervalued by checking out our comprehensive analysis, which includes fair value estimates, risks and warnings, dividends, insider transactions and financial health.
View the Free AnalysisHave feedback on this article? Concerned about the content? Get in touch with us directly. Alternatively, email editorial-team (at) simplywallst.com.
This article by Simply Wall St is general in nature. We provide commentary based on historical data and analyst forecasts only using an unbiased methodology and our articles are not intended to be financial advice. It does not constitute a recommendation to buy or sell any stock, and does not take account of your objectives, or your financial situation. We aim to bring you long-term focused analysis driven by fundamental data. Note that our analysis may not factor in the latest price-sensitive company announcements or qualitative material. Simply Wall St has no position in any stocks mentioned.
About LSE:CLIG
City of London Investment Group
City of London Investment Group PLC is a publically owned investment manager.
Flawless balance sheet, good value and pays a dividend.
