Stock Analysis
- United Kingdom
- /
- Capital Markets
- /
- AIM:BRH
While shareholders of Braveheart Investment Group (LON:BRH) are in the black over 3 years, those who bought a week ago aren't so fortunate


Many investors define successful investing as beating the market average over the long term. But the risk of stock picking is that you will likely buy under-performing companies. Unfortunately, that's been the case for longer term Braveheart Investment Group plc (LON:BRH) shareholders, since the share price is down 76% in the last three years, falling well short of the market return of around 22%. The falls have accelerated recently, with the share price down 31% in the last three months.
Since Braveheart Investment Group has shed UK£1.1m from its value in the past 7 days, let's see if the longer term decline has been driven by the business' economics.
Check out our latest analysis for Braveheart Investment Group
While the efficient markets hypothesis continues to be taught by some, it has been proven that markets are over-reactive dynamic systems, and investors are not always rational. One flawed but reasonable way to assess how sentiment around a company has changed is to compare the earnings per share (EPS) with the share price.
During five years of share price growth, Braveheart Investment Group moved from a loss to profitability. That would generally be considered a positive, so we are surprised to see the share price is down. So given the share price is down it's worth checking some other metrics too.
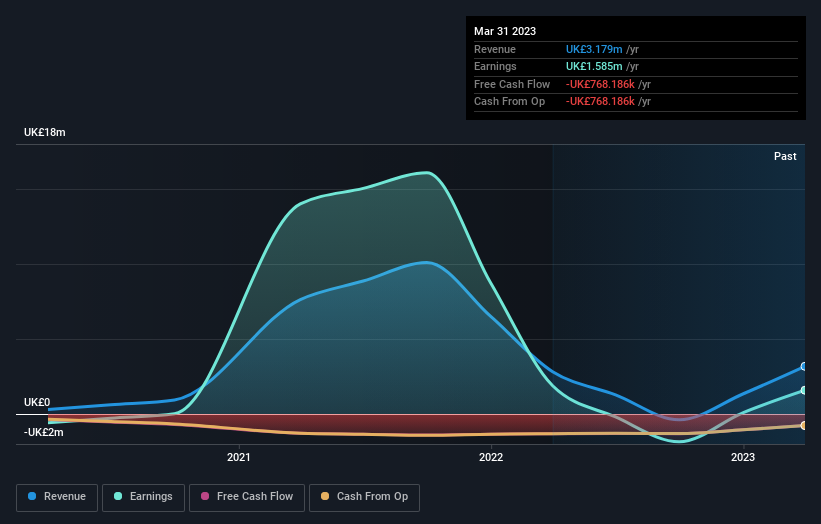
The company has kept revenue pretty healthy over the last three years, so we doubt that explains the falling share price. There doesn't seem to be any clear correlation between the fundamental business metrics and the share price. That could mean that the stock was previously overrated, or it could spell opportunity now.
You can see how earnings and revenue have changed over time in the image below (click on the chart to see the exact values).
We're pleased to report that the CEO is remunerated more modestly than most CEOs at similarly capitalized companies. It's always worth keeping an eye on CEO pay, but a more important question is whether the company will grow earnings throughout the years. Dive deeper into the earnings by checking this interactive graph of Braveheart Investment Group's earnings, revenue and cash flow.
What About The Total Shareholder Return (TSR)?
Investors should note that there's a difference between Braveheart Investment Group's total shareholder return (TSR) and its share price change, which we've covered above. The TSR is a return calculation that accounts for the value of cash dividends (assuming that any dividend received was reinvested) and the calculated value of any discounted capital raisings and spin-offs. Braveheart Investment Group's TSR of 15% for the 3 years exceeded its share price return, because it has paid dividends.
A Different Perspective
Braveheart Investment Group's TSR for the year was broadly in line with the market average, at 6.9%. It has to be noted that the recent return falls short of the 21% shareholders have gained each year, over half a decade. Although the share price growth has slowed, the longer term story points to a business well worth watching. It's always interesting to track share price performance over the longer term. But to understand Braveheart Investment Group better, we need to consider many other factors. For instance, we've identified 3 warning signs for Braveheart Investment Group (2 shouldn't be ignored) that you should be aware of.
But note: Braveheart Investment Group may not be the best stock to buy. So take a peek at this free list of interesting companies with past earnings growth (and further growth forecast).
Please note, the market returns quoted in this article reflect the market weighted average returns of stocks that currently trade on British exchanges.
Valuation is complex, but we're helping make it simple.
Find out whether Braveheart Investment Group is potentially over or undervalued by checking out our comprehensive analysis, which includes fair value estimates, risks and warnings, dividends, insider transactions and financial health.
View the Free AnalysisHave feedback on this article? Concerned about the content? Get in touch with us directly. Alternatively, email editorial-team (at) simplywallst.com.
This article by Simply Wall St is general in nature. We provide commentary based on historical data and analyst forecasts only using an unbiased methodology and our articles are not intended to be financial advice. It does not constitute a recommendation to buy or sell any stock, and does not take account of your objectives, or your financial situation. We aim to bring you long-term focused analysis driven by fundamental data. Note that our analysis may not factor in the latest price-sensitive company announcements or qualitative material. Simply Wall St has no position in any stocks mentioned.
About AIM:BRH
Braveheart Investment Group
A private equity and venture capital firm specializing in loan, mezzanine, seed/startup, early venture, late stage, emerging growth, turnaround, distress situations, buyout in growth capital companies.
Flawless balance sheet and good value.
