Stock Analysis
- United Kingdom
- /
- Luxury
- /
- LSE:BRBY
Burberry Group (LON:BRBY) shareholders have endured a 46% loss from investing in the stock a year ago

It's easy to match the overall market return by buying an index fund. But if you buy individual stocks, you can do both better or worse than that. Unfortunately the Burberry Group plc (LON:BRBY) share price slid 47% over twelve months. That's disappointing when you consider the market declined 0.8%. At least the damage isn't so bad if you look at the last three years, since the stock is down 30% in that time. Furthermore, it's down 11% in about a quarter. That's not much fun for holders.
It's worthwhile assessing if the company's economics have been moving in lockstep with these underwhelming shareholder returns, or if there is some disparity between the two. So let's do just that.
Check out our latest analysis for Burberry Group
In his essay The Superinvestors of Graham-and-Doddsville Warren Buffett described how share prices do not always rationally reflect the value of a business. One flawed but reasonable way to assess how sentiment around a company has changed is to compare the earnings per share (EPS) with the share price.
Even though the Burberry Group share price is down over the year, its EPS actually improved. Of course, the situation might betray previous over-optimism about growth.
It's surprising to see the share price fall so much, despite the improved EPS. But we might find some different metrics explain the share price movements better.
Burberry Group's dividend seems healthy to us, so we doubt that the yield is a concern for the market. The revenue trend doesn't seem to explain why the share price is down. Of course, it could simply be that it simply fell short of the market consensus expectations.
The graphic below depicts how earnings and revenue have changed over time (unveil the exact values by clicking on the image).
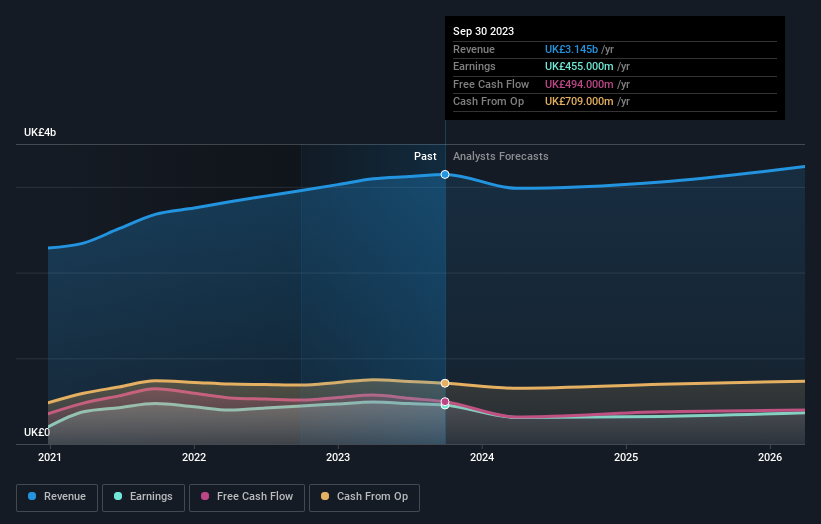
It's probably worth noting we've seen significant insider buying in the last quarter, which we consider a positive. On the other hand, we think the revenue and earnings trends are much more meaningful measures of the business. You can see what analysts are predicting for Burberry Group in this interactive graph of future profit estimates.
A Different Perspective
While the broader market lost about 0.8% in the twelve months, Burberry Group shareholders did even worse, losing 46% (even including dividends). However, it could simply be that the share price has been impacted by broader market jitters. It might be worth keeping an eye on the fundamentals, in case there's a good opportunity. Unfortunately, last year's performance may indicate unresolved challenges, given that it was worse than the annualised loss of 5% over the last half decade. Generally speaking long term share price weakness can be a bad sign, though contrarian investors might want to research the stock in hope of a turnaround. It's always interesting to track share price performance over the longer term. But to understand Burberry Group better, we need to consider many other factors. Consider risks, for instance. Every company has them, and we've spotted 1 warning sign for Burberry Group you should know about.
There are plenty of other companies that have insiders buying up shares. You probably do not want to miss this free list of growing companies that insiders are buying.
Please note, the market returns quoted in this article reflect the market weighted average returns of stocks that currently trade on British exchanges.
Valuation is complex, but we're helping make it simple.
Find out whether Burberry Group is potentially over or undervalued by checking out our comprehensive analysis, which includes fair value estimates, risks and warnings, dividends, insider transactions and financial health.
View the Free AnalysisHave feedback on this article? Concerned about the content? Get in touch with us directly. Alternatively, email editorial-team (at) simplywallst.com.
This article by Simply Wall St is general in nature. We provide commentary based on historical data and analyst forecasts only using an unbiased methodology and our articles are not intended to be financial advice. It does not constitute a recommendation to buy or sell any stock, and does not take account of your objectives, or your financial situation. We aim to bring you long-term focused analysis driven by fundamental data. Note that our analysis may not factor in the latest price-sensitive company announcements or qualitative material. Simply Wall St has no position in any stocks mentioned.
About LSE:BRBY
Burberry Group
Burberry Group plc, together with its subsidiaries, manufactures, retails, and wholesales luxury goods under the Burberry brand.
Undervalued with excellent balance sheet and pays a dividend.

