Stock Analysis
- United Kingdom
- /
- Commercial Services
- /
- LSE:DLAR
Even after rising 10% this past week, De La Rue (LON:DLAR) shareholders are still down 84% over the past five years

While not a mind-blowing move, it is good to see that the De La Rue plc (LON:DLAR) share price has gained 14% in the last three months. But will that repair the damage for the weary investors who have owned this stock as it declined over half a decade? Probably not. Like a ship taking on water, the share price has sunk 86% in that time. So we don't gain too much confidence from the recent recovery. The real question is whether the business can leave its past behind and improve itself over the years ahead. While a drop like that is definitely a body blow, money isn't as important as health and happiness.
While the last five years has been tough for De La Rue shareholders, this past week has shown signs of promise. So let's look at the longer term fundamentals and see if they've been the driver of the negative returns.
Check out our latest analysis for De La Rue
To paraphrase Benjamin Graham: Over the short term the market is a voting machine, but over the long term it's a weighing machine. One imperfect but simple way to consider how the market perception of a company has shifted is to compare the change in the earnings per share (EPS) with the share price movement.
Over five years De La Rue's earnings per share dropped significantly, falling to a loss, with the share price also lower. The recent extraordinary items contributed to this situation. Since the company has fallen to a loss making position, it's hard to compare the change in EPS with the share price change. But we would generally expect a lower price, given the situation.
The graphic below depicts how EPS has changed over time (unveil the exact values by clicking on the image).
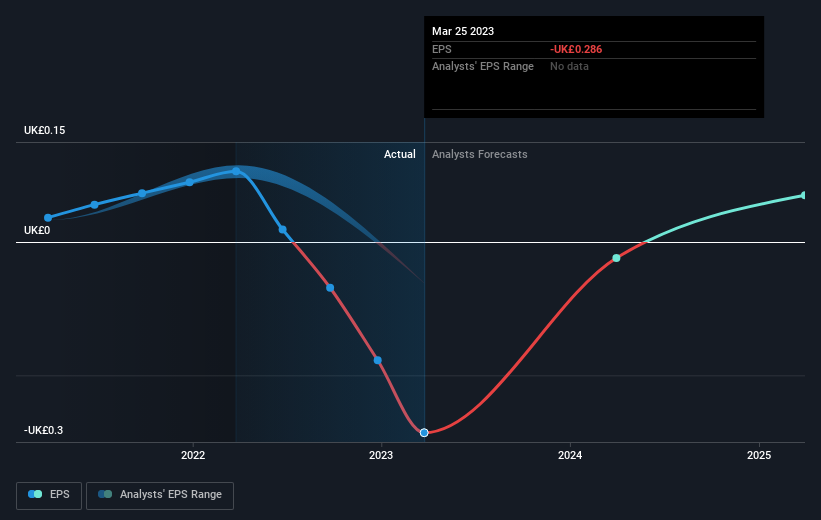
Dive deeper into De La Rue's key metrics by checking this interactive graph of De La Rue's earnings, revenue and cash flow.
What About The Total Shareholder Return (TSR)?
Investors should note that there's a difference between De La Rue's total shareholder return (TSR) and its share price change, which we've covered above. The TSR attempts to capture the value of dividends (as if they were reinvested) as well as any spin-offs or discounted capital raisings offered to shareholders. De La Rue's TSR of was a loss of 84% for the 5 years. That wasn't as bad as its share price return, because it has paid dividends.
A Different Perspective
De La Rue shareholders are down 15% for the year, but the market itself is up 0.08%. Even the share prices of good stocks drop sometimes, but we want to see improvements in the fundamental metrics of a business, before getting too interested. Unfortunately, longer term shareholders are suffering worse, given the loss of 13% doled out over the last five years. We would want clear information suggesting the company will grow, before taking the view that the share price will stabilize. I find it very interesting to look at share price over the long term as a proxy for business performance. But to truly gain insight, we need to consider other information, too. Even so, be aware that De La Rue is showing 1 warning sign in our investment analysis , you should know about...
But note: De La Rue may not be the best stock to buy. So take a peek at this free list of interesting companies with past earnings growth (and further growth forecast).
Please note, the market returns quoted in this article reflect the market weighted average returns of stocks that currently trade on British exchanges.
Valuation is complex, but we're helping make it simple.
Find out whether De La Rue is potentially over or undervalued by checking out our comprehensive analysis, which includes fair value estimates, risks and warnings, dividends, insider transactions and financial health.
View the Free AnalysisHave feedback on this article? Concerned about the content? Get in touch with us directly. Alternatively, email editorial-team (at) simplywallst.com.
This article by Simply Wall St is general in nature. We provide commentary based on historical data and analyst forecasts only using an unbiased methodology and our articles are not intended to be financial advice. It does not constitute a recommendation to buy or sell any stock, and does not take account of your objectives, or your financial situation. We aim to bring you long-term focused analysis driven by fundamental data. Note that our analysis may not factor in the latest price-sensitive company announcements or qualitative material. Simply Wall St has no position in any stocks mentioned.
About LSE:DLAR
De La Rue
Provides secure digital, physical, surety, and control solutions for government and commercial organization in the United Kingdom, the Middle East, Africa, Asia, the Americas, and internationally.
High growth potential and fair value.
