Stock Analysis
- United Kingdom
- /
- Trade Distributors
- /
- LSE:RS1
RS Group plc's (LON:RS1) Stock Is Going Strong: Is the Market Following Fundamentals?


RS Group (LON:RS1) has had a great run on the share market with its stock up by a significant 6.1% over the last week. Given the company's impressive performance, we decided to study its financial indicators more closely as a company's financial health over the long-term usually dictates market outcomes. Particularly, we will be paying attention to RS Group's ROE today.
Return on Equity or ROE is a test of how effectively a company is growing its value and managing investors’ money. Put another way, it reveals the company's success at turning shareholder investments into profits.
Check out our latest analysis for RS Group
How Is ROE Calculated?
The formula for return on equity is:
Return on Equity = Net Profit (from continuing operations) ÷ Shareholders' Equity
So, based on the above formula, the ROE for RS Group is:
17% = UK£236m ÷ UK£1.4b (Based on the trailing twelve months to September 2023).
The 'return' is the income the business earned over the last year. One way to conceptualize this is that for each £1 of shareholders' capital it has, the company made £0.17 in profit.
What Is The Relationship Between ROE And Earnings Growth?
So far, we've learned that ROE is a measure of a company's profitability. We now need to evaluate how much profit the company reinvests or "retains" for future growth which then gives us an idea about the growth potential of the company. Generally speaking, other things being equal, firms with a high return on equity and profit retention, have a higher growth rate than firms that don’t share these attributes.
RS Group's Earnings Growth And 17% ROE
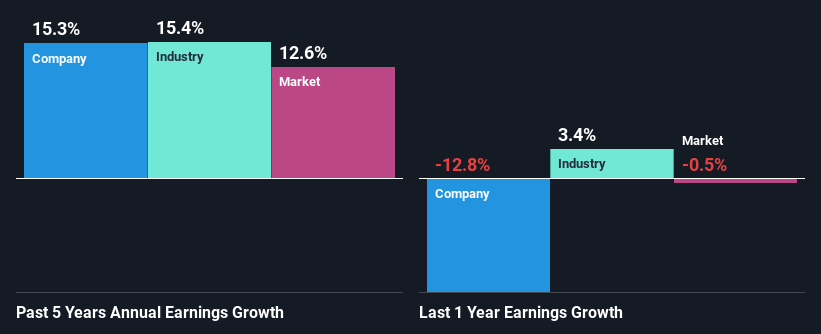
At first glance, RS Group seems to have a decent ROE. And on comparing with the industry, we found that the the average industry ROE is similar at 17%. This certainly adds some context to RS Group's moderate 15% net income growth seen over the past five years.
Next, on comparing RS Group's net income growth with the industry, we found that the company's reported growth is similar to the industry average growth rate of 15% over the last few years.
Earnings growth is a huge factor in stock valuation. What investors need to determine next is if the expected earnings growth, or the lack of it, is already built into the share price. This then helps them determine if the stock is placed for a bright or bleak future. Has the market priced in the future outlook for RS1? You can find out in our latest intrinsic value infographic research report.
Is RS Group Using Its Retained Earnings Effectively?
RS Group has a three-year median payout ratio of 39%, which implies that it retains the remaining 61% of its profits. This suggests that its dividend is well covered, and given the decent growth seen by the company, it looks like management is reinvesting its earnings efficiently.
Besides, RS Group has been paying dividends for at least ten years or more. This shows that the company is committed to sharing profits with its shareholders. Based on the latest analysts' estimates, we found that the company's future payout ratio over the next three years is expected to hold steady at 41%. Accordingly, forecasts suggest that RS Group's future ROE will be 16% which is again, similar to the current ROE.
Conclusion
On the whole, we feel that RS Group's performance has been quite good. Specifically, we like that the company is reinvesting a huge chunk of its profits at a high rate of return. This of course has caused the company to see substantial growth in its earnings. Having said that, the company's earnings growth is expected to slow down, as forecasted in the current analyst estimates. To know more about the latest analysts predictions for the company, check out this visualization of analyst forecasts for the company.
Valuation is complex, but we're helping make it simple.
Find out whether RS Group is potentially over or undervalued by checking out our comprehensive analysis, which includes fair value estimates, risks and warnings, dividends, insider transactions and financial health.
View the Free AnalysisHave feedback on this article? Concerned about the content? Get in touch with us directly. Alternatively, email editorial-team (at) simplywallst.com.
This article by Simply Wall St is general in nature. We provide commentary based on historical data and analyst forecasts only using an unbiased methodology and our articles are not intended to be financial advice. It does not constitute a recommendation to buy or sell any stock, and does not take account of your objectives, or your financial situation. We aim to bring you long-term focused analysis driven by fundamental data. Note that our analysis may not factor in the latest price-sensitive company announcements or qualitative material. Simply Wall St has no position in any stocks mentioned.
About LSE:RS1
RS Group
RS Group plc, together with its subsidiaries, distributes various electronics and industrial products and solutions in the United Kingdom, the United States, France, Germany, Italy, Mexico, and internationally.
Excellent balance sheet established dividend payer.
