Stock Analysis
- United Kingdom
- /
- Building
- /
- AIM:JHD
As James Halstead (LON:JHD) increases 5.2% this past week, investors may now be noticing the company's five-year earnings growth


For many, the main point of investing is to generate higher returns than the overall market. But even the best stock picker will only win with some selections. So we wouldn't blame long term James Halstead plc (LON:JHD) shareholders for doubting their decision to hold, with the stock down 20% over a half decade.
While the last five years has been tough for James Halstead shareholders, this past week has shown signs of promise. So let's look at the longer term fundamentals and see if they've been the driver of the negative returns.
Check out our latest analysis for James Halstead
While the efficient markets hypothesis continues to be taught by some, it has been proven that markets are over-reactive dynamic systems, and investors are not always rational. One flawed but reasonable way to assess how sentiment around a company has changed is to compare the earnings per share (EPS) with the share price.
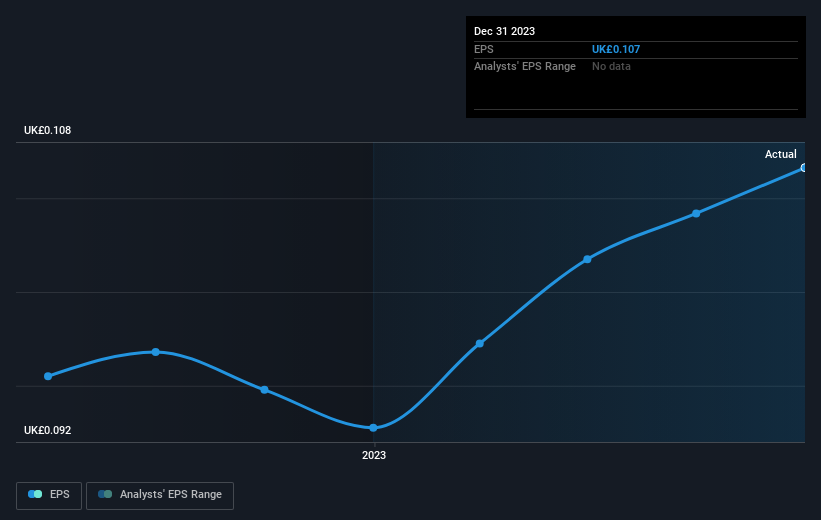
During the unfortunate half decade during which the share price slipped, James Halstead actually saw its earnings per share (EPS) improve by 3.5% per year. Given the share price reaction, one might suspect that EPS is not a good guide to the business performance during the period (perhaps due to a one-off loss or gain). Alternatively, growth expectations may have been unreasonable in the past.
Given EPS is up and the share price is down, it's clear the market is more concerned about the business than it was previously. Generally speaking, though, if the company can keep growing EPS then the share price will eventually follow.
The company's earnings per share (over time) is depicted in the image below (click to see the exact numbers).
We're pleased to report that the CEO is remunerated more modestly than most CEOs at similarly capitalized companies. It's always worth keeping an eye on CEO pay, but a more important question is whether the company will grow earnings throughout the years. This free interactive report on James Halstead's earnings, revenue and cash flow is a great place to start, if you want to investigate the stock further.
What About Dividends?
It is important to consider the total shareholder return, as well as the share price return, for any given stock. The TSR is a return calculation that accounts for the value of cash dividends (assuming that any dividend received was reinvested) and the calculated value of any discounted capital raisings and spin-offs. It's fair to say that the TSR gives a more complete picture for stocks that pay a dividend. As it happens, James Halstead's TSR for the last 5 years was -6.5%, which exceeds the share price return mentioned earlier. The dividends paid by the company have thusly boosted the total shareholder return.
A Different Perspective
James Halstead provided a TSR of 2.4% over the last twelve months. But that was short of the market average. On the bright side, that's still a gain, and it is certainly better than the yearly loss of about 1.3% endured over half a decade. So this might be a sign the business has turned its fortunes around. If you would like to research James Halstead in more detail then you might want to take a look at whether insiders have been buying or selling shares in the company.
If you would prefer to check out another company -- one with potentially superior financials -- then do not miss this free list of companies that have proven they can grow earnings.
Please note, the market returns quoted in this article reflect the market weighted average returns of stocks that currently trade on British exchanges.
Valuation is complex, but we're helping make it simple.
Find out whether James Halstead is potentially over or undervalued by checking out our comprehensive analysis, which includes fair value estimates, risks and warnings, dividends, insider transactions and financial health.
View the Free AnalysisHave feedback on this article? Concerned about the content? Get in touch with us directly. Alternatively, email editorial-team (at) simplywallst.com.
This article by Simply Wall St is general in nature. We provide commentary based on historical data and analyst forecasts only using an unbiased methodology and our articles are not intended to be financial advice. It does not constitute a recommendation to buy or sell any stock, and does not take account of your objectives, or your financial situation. We aim to bring you long-term focused analysis driven by fundamental data. Note that our analysis may not factor in the latest price-sensitive company announcements or qualitative material. Simply Wall St has no position in any stocks mentioned.
About AIM:JHD
James Halstead
James Halstead plc manufactures and supplies flooring products for commercial and domestic uses in the United Kingdom, rest of Europe, Scandinavia, Australasia, Asia, and internationally.
Outstanding track record with flawless balance sheet and pays a dividend.
