- France
- /
- Transportation
- /
- ENXTPA:STF
Is STEF SA's (EPA:STF) Latest Stock Performance Being Led By Its Strong Fundamentals?


STEF's (EPA:STF) stock is up by 5.8% over the past three months. Given that the market rewards strong financials in the long-term, we wonder if that is the case in this instance. In this article, we decided to focus on STEF's ROE.
Return on Equity or ROE is a test of how effectively a company is growing its value and managing investors’ money. In short, ROE shows the profit each dollar generates with respect to its shareholder investments.
See our latest analysis for STEF
How Do You Calculate Return On Equity?
The formula for ROE is:
Return on Equity = Net Profit (from continuing operations) ÷ Shareholders' Equity
So, based on the above formula, the ROE for STEF is:
15% = €175m ÷ €1.2b (Based on the trailing twelve months to December 2023).
The 'return' refers to a company's earnings over the last year. So, this means that for every €1 of its shareholder's investments, the company generates a profit of €0.15.
What Has ROE Got To Do With Earnings Growth?
We have already established that ROE serves as an efficient profit-generating gauge for a company's future earnings. We now need to evaluate how much profit the company reinvests or "retains" for future growth which then gives us an idea about the growth potential of the company. Assuming everything else remains unchanged, the higher the ROE and profit retention, the higher the growth rate of a company compared to companies that don't necessarily bear these characteristics.
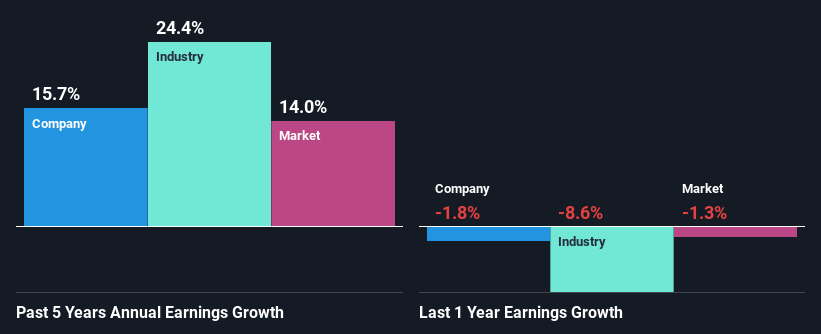
STEF's Earnings Growth And 15% ROE
At first glance, STEF seems to have a decent ROE. And on comparing with the industry, we found that the the average industry ROE is similar at 12%. This probably goes some way in explaining STEF's moderate 16% growth over the past five years amongst other factors.
Next, on comparing with the industry net income growth, we found that STEF's reported growth was lower than the industry growth of 24% over the last few years, which is not something we like to see.
The basis for attaching value to a company is, to a great extent, tied to its earnings growth. It’s important for an investor to know whether the market has priced in the company's expected earnings growth (or decline). Doing so will help them establish if the stock's future looks promising or ominous. One good indicator of expected earnings growth is the P/E ratio which determines the price the market is willing to pay for a stock based on its earnings prospects. So, you may want to check if STEF is trading on a high P/E or a low P/E, relative to its industry.
Is STEF Using Its Retained Earnings Effectively?
With a three-year median payout ratio of 30% (implying that the company retains 70% of its profits), it seems that STEF is reinvesting efficiently in a way that it sees respectable amount growth in its earnings and pays a dividend that's well covered.
Additionally, STEF has paid dividends over a period of at least ten years which means that the company is pretty serious about sharing its profits with shareholders. Based on the latest analysts' estimates, we found that the company's future payout ratio over the next three years is expected to hold steady at 34%. As a result, STEF's ROE is not expected to change by much either, which we inferred from the analyst estimate of 13% for future ROE.
Conclusion
On the whole, we feel that STEF's performance has been quite good. Particularly, we like that the company is reinvesting heavily into its business, and at a high rate of return. As a result, the decent growth in its earnings is not surprising. With that said, the latest industry analyst forecasts reveal that the company's earnings growth is expected to slow down. To know more about the latest analysts predictions for the company, check out this visualization of analyst forecasts for the company.
New: Manage All Your Stock Portfolios in One Place
We've created the ultimate portfolio companion for stock investors, and it's free.
• Connect an unlimited number of Portfolios and see your total in one currency
• Be alerted to new Warning Signs or Risks via email or mobile
• Track the Fair Value of your stocks
Have feedback on this article? Concerned about the content? Get in touch with us directly. Alternatively, email editorial-team (at) simplywallst.com.
This article by Simply Wall St is general in nature. We provide commentary based on historical data and analyst forecasts only using an unbiased methodology and our articles are not intended to be financial advice. It does not constitute a recommendation to buy or sell any stock, and does not take account of your objectives, or your financial situation. We aim to bring you long-term focused analysis driven by fundamental data. Note that our analysis may not factor in the latest price-sensitive company announcements or qualitative material. Simply Wall St has no position in any stocks mentioned.
About ENXTPA:STF
STEF
Provides temperature-controlled road transport and logistics services for agri-food industry, and out-of-home foodservices.
Undervalued with adequate balance sheet.
