Stock Analysis
Are Robust Financials Driving The Recent Rally In Capgemini SE's (EPA:CAP) Stock?


Capgemini (EPA:CAP) has had a great run on the share market with its stock up by a significant 13% over the last three months. Given that the market rewards strong financials in the long-term, we wonder if that is the case in this instance. In this article, we decided to focus on Capgemini's ROE.
Return on equity or ROE is a key measure used to assess how efficiently a company's management is utilizing the company's capital. In other words, it is a profitability ratio which measures the rate of return on the capital provided by the company's shareholders.
Check out our latest analysis for Capgemini
How Is ROE Calculated?
The formula for return on equity is:
Return on Equity = Net Profit (from continuing operations) ÷ Shareholders' Equity
So, based on the above formula, the ROE for Capgemini is:
16% = €1.7b ÷ €10b (Based on the trailing twelve months to December 2023).
The 'return' is the profit over the last twelve months. That means that for every €1 worth of shareholders' equity, the company generated €0.16 in profit.
What Is The Relationship Between ROE And Earnings Growth?
So far, we've learned that ROE is a measure of a company's profitability. We now need to evaluate how much profit the company reinvests or "retains" for future growth which then gives us an idea about the growth potential of the company. Assuming all else is equal, companies that have both a higher return on equity and higher profit retention are usually the ones that have a higher growth rate when compared to companies that don't have the same features.
Capgemini's Earnings Growth And 16% ROE
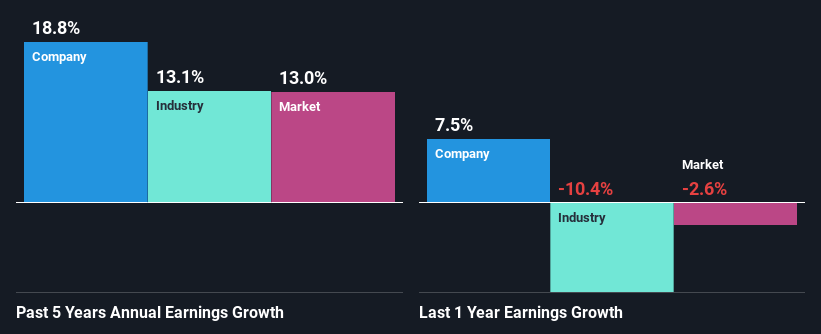
To begin with, Capgemini seems to have a respectable ROE. Further, the company's ROE compares quite favorably to the industry average of 12%. This probably laid the ground for Capgemini's moderate 19% net income growth seen over the past five years.
Next, on comparing with the industry net income growth, we found that Capgemini's growth is quite high when compared to the industry average growth of 13% in the same period, which is great to see.
The basis for attaching value to a company is, to a great extent, tied to its earnings growth. It’s important for an investor to know whether the market has priced in the company's expected earnings growth (or decline). By doing so, they will have an idea if the stock is headed into clear blue waters or if swampy waters await. Is CAP fairly valued? This infographic on the company's intrinsic value has everything you need to know.
Is Capgemini Using Its Retained Earnings Effectively?
With a three-year median payout ratio of 33% (implying that the company retains 67% of its profits), it seems that Capgemini is reinvesting efficiently in a way that it sees respectable amount growth in its earnings and pays a dividend that's well covered.
Moreover, Capgemini is determined to keep sharing its profits with shareholders which we infer from its long history of paying a dividend for at least ten years. Based on the latest analysts' estimates, we found that the company's future payout ratio over the next three years is expected to hold steady at 30%. Therefore, the company's future ROE is also not expected to change by much with analysts predicting an ROE of 17%.
Conclusion
Overall, we are quite pleased with Capgemini's performance. Specifically, we like that the company is reinvesting a huge chunk of its profits at a high rate of return. This of course has caused the company to see substantial growth in its earnings. Having said that, the company's earnings growth is expected to slow down, as forecasted in the current analyst estimates. Are these analysts expectations based on the broad expectations for the industry, or on the company's fundamentals? Click here to be taken to our analyst's forecasts page for the company.
Valuation is complex, but we're helping make it simple.
Find out whether Capgemini is potentially over or undervalued by checking out our comprehensive analysis, which includes fair value estimates, risks and warnings, dividends, insider transactions and financial health.
View the Free AnalysisHave feedback on this article? Concerned about the content? Get in touch with us directly. Alternatively, email editorial-team (at) simplywallst.com.
This article by Simply Wall St is general in nature. We provide commentary based on historical data and analyst forecasts only using an unbiased methodology and our articles are not intended to be financial advice. It does not constitute a recommendation to buy or sell any stock, and does not take account of your objectives, or your financial situation. We aim to bring you long-term focused analysis driven by fundamental data. Note that our analysis may not factor in the latest price-sensitive company announcements or qualitative material. Simply Wall St has no position in any stocks mentioned.
About ENXTPA:CAP
Capgemini
Capgemini SE, together with its subsidiaries, engages in the provision of consulting, digital transformation, technology, and engineering services primarily in North America, France, the United Kingdom, Ireland, the rest of Europe, the Asia-Pacific, and Latin America.
Undervalued with excellent balance sheet.
