
Advertisement
How Much Did Paref's(EPA:PAR) Shareholders Earn From Share Price Movements Over The Last Three Years?
For many investors, the main point of stock picking is to generate higher returns than the overall market. But the risk of stock picking is that you will likely buy under-performing companies. Unfortunately, that's been the case for longer term Paref SA (EPA:PAR) shareholders, since the share price is down 13% in the last three years, falling well short of the market return of around 29%.
Check out our latest analysis for Paref
While the efficient markets hypothesis continues to be taught by some, it has been proven that markets are over-reactive dynamic systems, and investors are not always rational. One imperfect but simple way to consider how the market perception of a company has shifted is to compare the change in the earnings per share (EPS) with the share price movement.
Paref saw its EPS decline at a compound rate of 7.3% per year, over the last three years. This fall in the EPS is worse than the 5% compound annual share price fall. So, despite the prior disappointment, shareholders must have some confidence the situation will improve, longer term.
You can see below how EPS has changed over time (discover the exact values by clicking on the image).
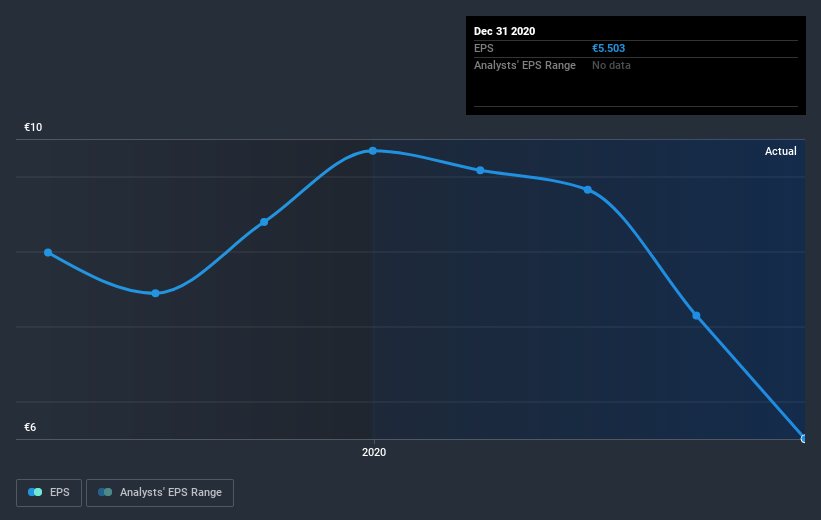
This free interactive report on Paref's earnings, revenue and cash flow is a great place to start, if you want to investigate the stock further.
What About Dividends?
As well as measuring the share price return, investors should also consider the total shareholder return (TSR). Whereas the share price return only reflects the change in the share price, the TSR includes the value of dividends (assuming they were reinvested) and the benefit of any discounted capital raising or spin-off. Arguably, the TSR gives a more comprehensive picture of the return generated by a stock. We note that for Paref the TSR over the last 3 years was 0.5%, which is better than the share price return mentioned above. This is largely a result of its dividend payments!
A Different Perspective
Paref provided a TSR of 1.7% over the last twelve months. Unfortunately this falls short of the market return. If we look back over five years, the returns are even better, coming in at 6% per year for five years. Maybe the share price is just taking a breather while the business executes on its growth strategy. It's always interesting to track share price performance over the longer term. But to understand Paref better, we need to consider many other factors. Take risks, for example - Paref has 4 warning signs (and 1 which is a bit unpleasant) we think you should know about.
If you would prefer to check out another company -- one with potentially superior financials -- then do not miss this free list of companies that have proven they can grow earnings.
Please note, the market returns quoted in this article reflect the market weighted average returns of stocks that currently trade on FR exchanges.
If you’re looking to trade Paref, open an account with the lowest-cost* platform trusted by professionals, Interactive Brokers. Their clients from over 200 countries and territories trade stocks, options, futures, forex, bonds and funds worldwide from a single integrated account. Promoted
New: Manage All Your Stock Portfolios in One Place
We've created the ultimate portfolio companion for stock investors, and it's free.
• Connect an unlimited number of Portfolios and see your total in one currency
• Be alerted to new Warning Signs or Risks via email or mobile
• Track the Fair Value of your stocks
This article by Simply Wall St is general in nature. It does not constitute a recommendation to buy or sell any stock, and does not take account of your objectives, or your financial situation. We aim to bring you long-term focused analysis driven by fundamental data. Note that our analysis may not factor in the latest price-sensitive company announcements or qualitative material. Simply Wall St has no position in any stocks mentioned.
*Interactive Brokers Rated Lowest Cost Broker by StockBrokers.com Annual Online Review 2020
Have feedback on this article? Concerned about the content? Get in touch with us directly. Alternatively, email editorial-team (at) simplywallst.com.
About ENXTPA:PAR
Paref
Owns and manages business real estate located primarily in the Paris region.
Slight risk second-rate dividend payer.
Market Insights

Advertisement
Community Narratives
The "Molecular Pencil": Why Beam's Technology is Built to Win
Fair Value US$65.01|66.7% undervalued
DA
Community Contributor
The silent giant behind virtually every advanced chip powering AI, smartphones, and modern infrastructure.
Fair Value US$310.00|4.8% undervalued
OS
Community Contributor
ADP Stock: Solid Fundamentals, But AI Investments Test Its Margin Resilience
Fair Value US$387.77|34.5% undervalued
YI
Community Contributor
MINISO's fair value is projected at 26.69 with an anticipated PE ratio shift of 20x
Fair Value US$26.69|18.6% undervalued
BE
Community Contributor