Stock Analysis
- France
- /
- Real Estate
- /
- ENXTPA:NXI
Nexity's (EPA:NXI) earnings trajectory could turn positive as the stock climbs 6.3% this past week

The main aim of stock picking is to find the market-beating stocks. But even the best stock picker will only win with some selections. So we wouldn't blame long term Nexity SA (EPA:NXI) shareholders for doubting their decision to hold, with the stock down 66% over a half decade. We also note that the stock has performed poorly over the last year, with the share price down 35%. On the other hand, we note it's up 8.5% in about a month. But this could be related to good market conditions, with stocks up around 5.0% during the period.
The recent uptick of 6.3% could be a positive sign of things to come, so let's take a look at historical fundamentals.
Check out our latest analysis for Nexity
While markets are a powerful pricing mechanism, share prices reflect investor sentiment, not just underlying business performance. One way to examine how market sentiment has changed over time is to look at the interaction between a company's share price and its earnings per share (EPS).
Looking back five years, both Nexity's share price and EPS declined; the latter at a rate of 13% per year. Readers should note that the share price has fallen faster than the EPS, at a rate of 19% per year, over the period. This implies that the market is more cautious about the business these days. The low P/E ratio of 5.75 further reflects this reticence.
The company's earnings per share (over time) is depicted in the image below (click to see the exact numbers).
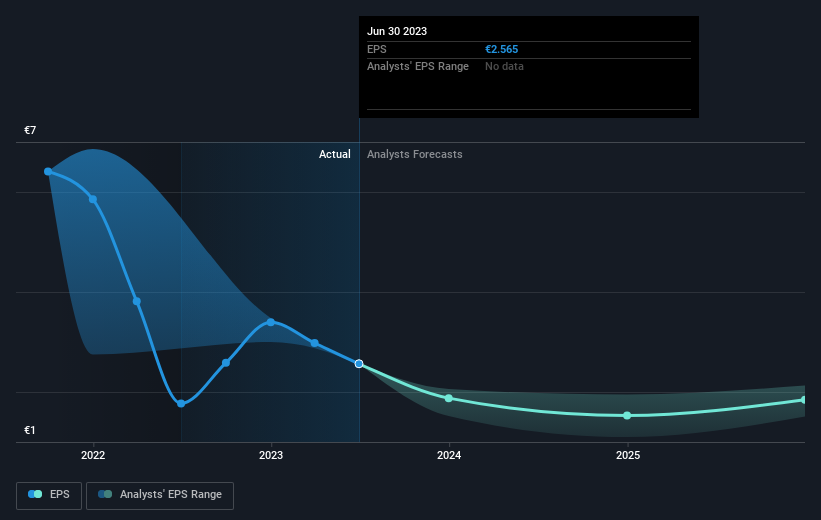
We know that Nexity has improved its bottom line lately, but is it going to grow revenue? Check if analysts think Nexity will grow revenue in the future.
What About Dividends?
It is important to consider the total shareholder return, as well as the share price return, for any given stock. The TSR is a return calculation that accounts for the value of cash dividends (assuming that any dividend received was reinvested) and the calculated value of any discounted capital raisings and spin-offs. It's fair to say that the TSR gives a more complete picture for stocks that pay a dividend. As it happens, Nexity's TSR for the last 5 years was -50%, which exceeds the share price return mentioned earlier. This is largely a result of its dividend payments!
A Different Perspective
Investors in Nexity had a tough year, with a total loss of 27% (including dividends), against a market gain of about 10%. Even the share prices of good stocks drop sometimes, but we want to see improvements in the fundamental metrics of a business, before getting too interested. Unfortunately, last year's performance may indicate unresolved challenges, given that it was worse than the annualised loss of 8% over the last half decade. We realise that Baron Rothschild has said investors should "buy when there is blood on the streets", but we caution that investors should first be sure they are buying a high quality business. I find it very interesting to look at share price over the long term as a proxy for business performance. But to truly gain insight, we need to consider other information, too. Take risks, for example - Nexity has 4 warning signs (and 2 which shouldn't be ignored) we think you should know about.
If you would prefer to check out another company -- one with potentially superior financials -- then do not miss this free list of companies that have proven they can grow earnings.
Please note, the market returns quoted in this article reflect the market weighted average returns of stocks that currently trade on French exchanges.
Valuation is complex, but we're helping make it simple.
Find out whether Nexity is potentially over or undervalued by checking out our comprehensive analysis, which includes fair value estimates, risks and warnings, dividends, insider transactions and financial health.
View the Free AnalysisHave feedback on this article? Concerned about the content? Get in touch with us directly. Alternatively, email editorial-team (at) simplywallst.com.
This article by Simply Wall St is general in nature. We provide commentary based on historical data and analyst forecasts only using an unbiased methodology and our articles are not intended to be financial advice. It does not constitute a recommendation to buy or sell any stock, and does not take account of your objectives, or your financial situation. We aim to bring you long-term focused analysis driven by fundamental data. Note that our analysis may not factor in the latest price-sensitive company announcements or qualitative material. Simply Wall St has no position in any stocks mentioned.
About ENXTPA:NXI
Nexity
Nexity SA operates as a real estate company in Europe and internationally.
Moderate growth potential and slightly overvalued.

