Stock Analysis

By buying an index fund, investors can approximate the average market return. But many of us dare to dream of bigger returns, and build a portfolio ourselves. For example, Publicis Groupe S.A. (EPA:PUB) shareholders have seen the share price rise 89% over three years, well in excess of the market return (23%, not including dividends). However, more recent returns haven't been as impressive as that, with the stock returning just 40% in the last year , including dividends .
Now it's worth having a look at the company's fundamentals too, because that will help us determine if the long term shareholder return has matched the performance of the underlying business.
View our latest analysis for Publicis Groupe
To paraphrase Benjamin Graham: Over the short term the market is a voting machine, but over the long term it's a weighing machine. One imperfect but simple way to consider how the market perception of a company has shifted is to compare the change in the earnings per share (EPS) with the share price movement.
During three years of share price growth, Publicis Groupe achieved compound earnings per share growth of 25% per year. We note that the 24% yearly (average) share price gain isn't too far from the EPS growth rate. Coincidence? Probably not. That suggests that the market sentiment around the company hasn't changed much over that time. Quite to the contrary, the share price has arguably reflected the EPS growth.
The image below shows how EPS has tracked over time (if you click on the image you can see greater detail).
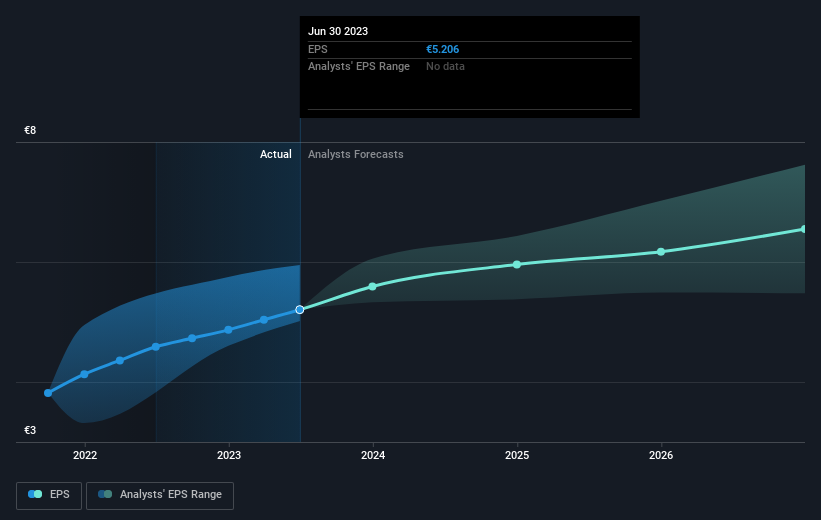
We know that Publicis Groupe has improved its bottom line lately, but is it going to grow revenue? This free report showing analyst revenue forecasts should help you figure out if the EPS growth can be sustained.
What About Dividends?
When looking at investment returns, it is important to consider the difference between total shareholder return (TSR) and share price return. The TSR incorporates the value of any spin-offs or discounted capital raisings, along with any dividends, based on the assumption that the dividends are reinvested. Arguably, the TSR gives a more comprehensive picture of the return generated by a stock. As it happens, Publicis Groupe's TSR for the last 3 years was 116%, which exceeds the share price return mentioned earlier. The dividends paid by the company have thusly boosted the total shareholder return.
A Different Perspective
We're pleased to report that Publicis Groupe shareholders have received a total shareholder return of 40% over one year. Of course, that includes the dividend. Since the one-year TSR is better than the five-year TSR (the latter coming in at 15% per year), it would seem that the stock's performance has improved in recent times. In the best case scenario, this may hint at some real business momentum, implying that now could be a great time to delve deeper. I find it very interesting to look at share price over the long term as a proxy for business performance. But to truly gain insight, we need to consider other information, too. Even so, be aware that Publicis Groupe is showing 1 warning sign in our investment analysis , you should know about...
If you are like me, then you will not want to miss this free list of growing companies that insiders are buying.
Please note, the market returns quoted in this article reflect the market weighted average returns of stocks that currently trade on French exchanges.
Valuation is complex, but we're helping make it simple.
Find out whether Publicis Groupe is potentially over or undervalued by checking out our comprehensive analysis, which includes fair value estimates, risks and warnings, dividends, insider transactions and financial health.
View the Free AnalysisHave feedback on this article? Concerned about the content? Get in touch with us directly. Alternatively, email editorial-team (at) simplywallst.com.
This article by Simply Wall St is general in nature. We provide commentary based on historical data and analyst forecasts only using an unbiased methodology and our articles are not intended to be financial advice. It does not constitute a recommendation to buy or sell any stock, and does not take account of your objectives, or your financial situation. We aim to bring you long-term focused analysis driven by fundamental data. Note that our analysis may not factor in the latest price-sensitive company announcements or qualitative material. Simply Wall St has no position in any stocks mentioned.
About ENXTPA:PUB
Publicis Groupe
Publicis Groupe S.A. provides marketing, communications, and digital business transformation services in North America, Europe, the Asia Pacific, Latin America, Africa, and the Middle East.
Excellent balance sheet, good value and pays a dividend.

