Stock Analysis
- France
- /
- Medical Equipment
- /
- ENXTPA:GBT
The 11% return this week takes Guerbet's (EPA:GBT) shareholders one-year gains to 97%

These days it's easy to simply buy an index fund, and your returns should (roughly) match the market. But investors can boost returns by picking market-beating companies to own shares in. For example, the Guerbet SA (EPA:GBT) share price is up 91% in the last 1 year, clearly besting the market return of around 9.6% (not including dividends). If it can keep that out-performance up over the long term, investors will do very well! The longer term returns have not been as good, with the stock price only 1.2% higher than it was three years ago.
Since the stock has added €40m to its market cap in the past week alone, let's see if underlying performance has been driving long-term returns.
Check out our latest analysis for Guerbet
There is no denying that markets are sometimes efficient, but prices do not always reflect underlying business performance. One flawed but reasonable way to assess how sentiment around a company has changed is to compare the earnings per share (EPS) with the share price.
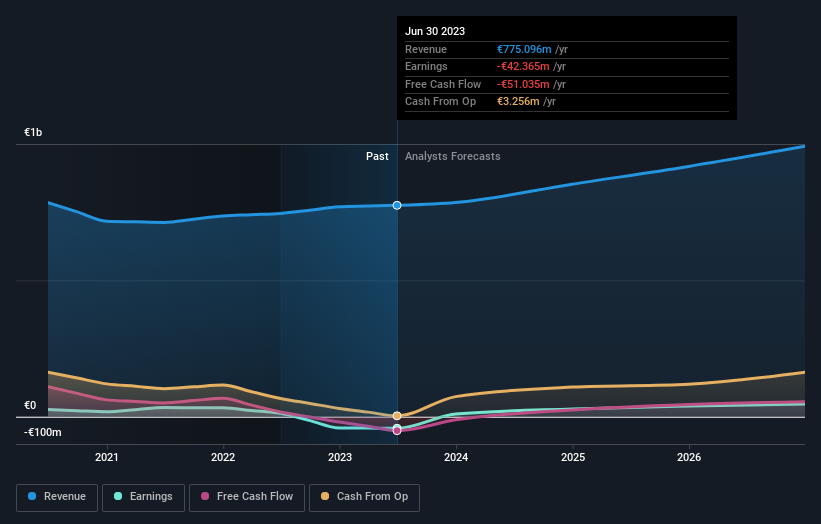
Over the last twelve months Guerbet went from profitable to unprofitable. While this may prove temporary, we'd consider it a negative, so we would not have expected to see the share price up. It may be that the company has done well on other metrics.
We are skeptical of the suggestion that the 1.5% dividend yield would entice buyers to the stock. We think that the revenue growth of 4.0% could have some investors interested. Many businesses do go through a phase where they have to forgo some profits to drive business development, and sometimes its for the best.
The company's revenue and earnings (over time) are depicted in the image below (click to see the exact numbers).
Balance sheet strength is crucial. It might be well worthwhile taking a look at our free report on how its financial position has changed over time.
What About Dividends?
When looking at investment returns, it is important to consider the difference between total shareholder return (TSR) and share price return. The TSR is a return calculation that accounts for the value of cash dividends (assuming that any dividend received was reinvested) and the calculated value of any discounted capital raisings and spin-offs. Arguably, the TSR gives a more comprehensive picture of the return generated by a stock. As it happens, Guerbet's TSR for the last 1 year was 97%, which exceeds the share price return mentioned earlier. The dividends paid by the company have thusly boosted the total shareholder return.
A Different Perspective
It's nice to see that Guerbet shareholders have received a total shareholder return of 97% over the last year. And that does include the dividend. That certainly beats the loss of about 6% per year over the last half decade. This makes us a little wary, but the business might have turned around its fortunes. I find it very interesting to look at share price over the long term as a proxy for business performance. But to truly gain insight, we need to consider other information, too. Like risks, for instance. Every company has them, and we've spotted 2 warning signs for Guerbet (of which 1 is significant!) you should know about.
If you like to buy stocks alongside management, then you might just love this free list of companies. (Hint: insiders have been buying them).
Please note, the market returns quoted in this article reflect the market weighted average returns of stocks that currently trade on French exchanges.
Valuation is complex, but we're helping make it simple.
Find out whether Guerbet is potentially over or undervalued by checking out our comprehensive analysis, which includes fair value estimates, risks and warnings, dividends, insider transactions and financial health.
View the Free AnalysisHave feedback on this article? Concerned about the content? Get in touch with us directly. Alternatively, email editorial-team (at) simplywallst.com.
This article by Simply Wall St is general in nature. We provide commentary based on historical data and analyst forecasts only using an unbiased methodology and our articles are not intended to be financial advice. It does not constitute a recommendation to buy or sell any stock, and does not take account of your objectives, or your financial situation. We aim to bring you long-term focused analysis driven by fundamental data. Note that our analysis may not factor in the latest price-sensitive company announcements or qualitative material. Simply Wall St has no position in any stocks mentioned.
About ENXTPA:GBT
Guerbet
Guerbet SA engages in the development and marketing of contrast media products, delivery systems, medical devices, and related solutions.
Undervalued with reasonable growth potential.

