Further weakness as Bonduelle (EPA:BON) drops 11% this week, taking five-year losses to 73%


Some stocks are best avoided. We don't wish catastrophic capital loss on anyone. Anyone who held Bonduelle SCA (EPA:BON) for five years would be nursing their metaphorical wounds since the share price dropped 75% in that time. And we doubt long term believers are the only worried holders, since the stock price has declined 41% over the last twelve months. Even worse, it's down 12% in about a month, which isn't fun at all. But this could be related to poor market conditions -- stocks are down 6.0% in the same time.
Given the past week has been tough on shareholders, let's investigate the fundamentals and see what we can learn.
See our latest analysis for Bonduelle
To paraphrase Benjamin Graham: Over the short term the market is a voting machine, but over the long term it's a weighing machine. One imperfect but simple way to consider how the market perception of a company has shifted is to compare the change in the earnings per share (EPS) with the share price movement.
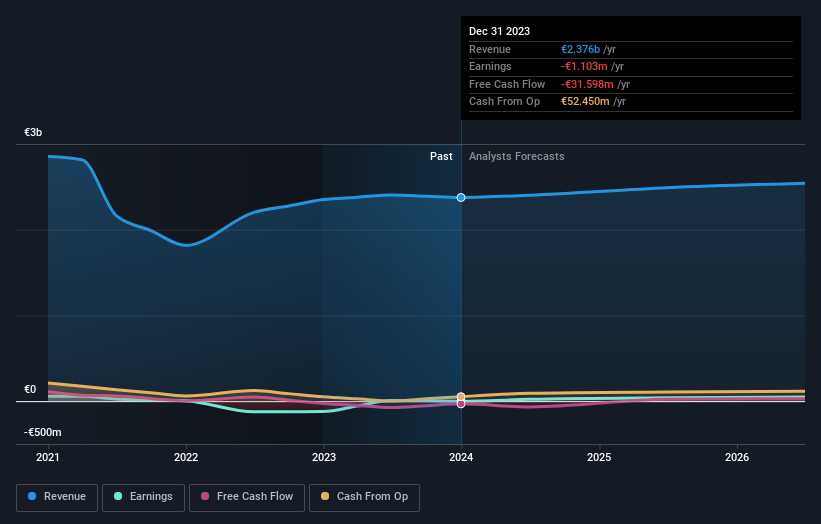
We know that Bonduelle has been profitable in the past. However, it made a loss in the last twelve months, suggesting profit may be an unreliable metric at this stage. Other metrics might give us a better handle on how its value is changing over time.
It could be that the revenue decline of 5.3% per year is viewed as evidence that Bonduelle is shrinking. This has probably encouraged some shareholders to sell down the stock.
The company's revenue and earnings (over time) are depicted in the image below (click to see the exact numbers).
Take a more thorough look at Bonduelle's financial health with this free report on its balance sheet.
What About Dividends?
When looking at investment returns, it is important to consider the difference between total shareholder return (TSR) and share price return. Whereas the share price return only reflects the change in the share price, the TSR includes the value of dividends (assuming they were reinvested) and the benefit of any discounted capital raising or spin-off. Arguably, the TSR gives a more comprehensive picture of the return generated by a stock. In the case of Bonduelle, it has a TSR of -73% for the last 5 years. That exceeds its share price return that we previously mentioned. This is largely a result of its dividend payments!
A Different Perspective
Investors in Bonduelle had a tough year, with a total loss of 40% (including dividends), against a market gain of about 3.9%. Even the share prices of good stocks drop sometimes, but we want to see improvements in the fundamental metrics of a business, before getting too interested. Unfortunately, last year's performance may indicate unresolved challenges, given that it was worse than the annualised loss of 12% over the last half decade. Generally speaking long term share price weakness can be a bad sign, though contrarian investors might want to research the stock in hope of a turnaround. While it is well worth considering the different impacts that market conditions can have on the share price, there are other factors that are even more important. Even so, be aware that Bonduelle is showing 2 warning signs in our investment analysis , you should know about...
Of course Bonduelle may not be the best stock to buy. So you may wish to see this free collection of growth stocks.
Please note, the market returns quoted in this article reflect the market weighted average returns of stocks that currently trade on French exchanges.
Valuation is complex, but we're here to simplify it.
Discover if Bonduelle might be undervalued or overvalued with our detailed analysis, featuring fair value estimates, potential risks, dividends, insider trades, and its financial condition.
Access Free AnalysisHave feedback on this article? Concerned about the content? Get in touch with us directly. Alternatively, email editorial-team (at) simplywallst.com.
This article by Simply Wall St is general in nature. We provide commentary based on historical data and analyst forecasts only using an unbiased methodology and our articles are not intended to be financial advice. It does not constitute a recommendation to buy or sell any stock, and does not take account of your objectives, or your financial situation. We aim to bring you long-term focused analysis driven by fundamental data. Note that our analysis may not factor in the latest price-sensitive company announcements or qualitative material. Simply Wall St has no position in any stocks mentioned.
Have feedback on this article? Concerned about the content? Get in touch with us directly. Alternatively, email editorial-team@simplywallst.com
About ENXTPA:BON
Bonduelle
Produces, processes, and sells vegetables and fruits in Europe and internationally.
Undervalued with moderate growth potential.

