Stock Analysis
- France
- /
- Consumer Durables
- /
- ENXTPA:SK
SEB (EPA:SK) investors are sitting on a loss of 17% if they invested three years ago

In order to justify the effort of selecting individual stocks, it's worth striving to beat the returns from a market index fund. But in any portfolio, there are likely to be some stocks that fall short of that benchmark. Unfortunately, that's been the case for longer term SEB SA (EPA:SK) shareholders, since the share price is down 22% in the last three years, falling well short of the market return of around 40%.
With that in mind, it's worth seeing if the company's underlying fundamentals have been the driver of long term performance, or if there are some discrepancies.
View our latest analysis for SEB
While the efficient markets hypothesis continues to be taught by some, it has been proven that markets are over-reactive dynamic systems, and investors are not always rational. One flawed but reasonable way to assess how sentiment around a company has changed is to compare the earnings per share (EPS) with the share price.
During the unfortunate three years of share price decline, SEB actually saw its earnings per share (EPS) improve by 5.6% per year. This is quite a puzzle, and suggests there might be something temporarily buoying the share price. Or else the company was over-hyped in the past, and so its growth has disappointed.
Since the change in EPS doesn't seem to correlate with the change in share price, it's worth taking a look at other metrics.
We note that, in three years, revenue has actually grown at a 5.3% annual rate, so that doesn't seem to be a reason to sell shares. This analysis is just perfunctory, but it might be worth researching SEB more closely, as sometimes stocks fall unfairly. This could present an opportunity.
The graphic below depicts how earnings and revenue have changed over time (unveil the exact values by clicking on the image).
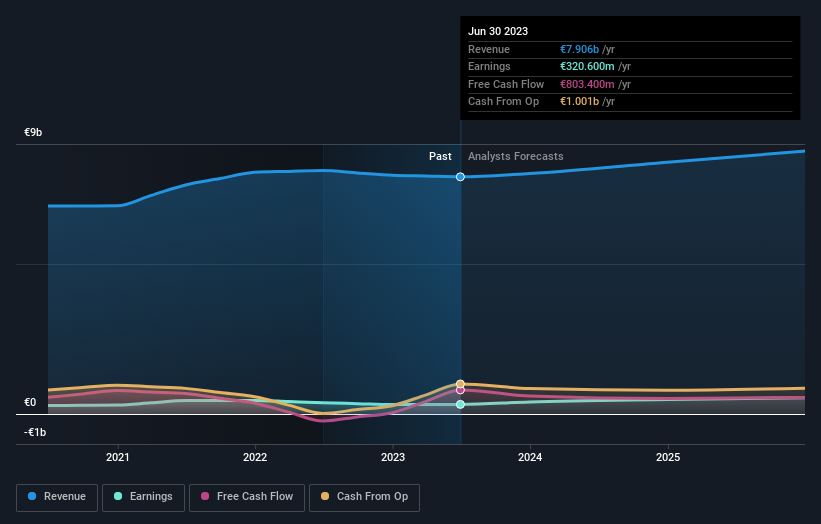
SEB is a well known stock, with plenty of analyst coverage, suggesting some visibility into future growth. So it makes a lot of sense to check out what analysts think SEB will earn in the future (free analyst consensus estimates)
What About Dividends?
As well as measuring the share price return, investors should also consider the total shareholder return (TSR). The TSR is a return calculation that accounts for the value of cash dividends (assuming that any dividend received was reinvested) and the calculated value of any discounted capital raisings and spin-offs. It's fair to say that the TSR gives a more complete picture for stocks that pay a dividend. In the case of SEB, it has a TSR of -17% for the last 3 years. That exceeds its share price return that we previously mentioned. And there's no prize for guessing that the dividend payments largely explain the divergence!
A Different Perspective
We're pleased to report that SEB shareholders have received a total shareholder return of 15% over one year. That's including the dividend. Notably the five-year annualised TSR loss of 0.7% per year compares very unfavourably with the recent share price performance. The long term loss makes us cautious, but the short term TSR gain certainly hints at a brighter future. While it is well worth considering the different impacts that market conditions can have on the share price, there are other factors that are even more important. Even so, be aware that SEB is showing 2 warning signs in our investment analysis , you should know about...
If you like to buy stocks alongside management, then you might just love this free list of companies. (Hint: insiders have been buying them).
Please note, the market returns quoted in this article reflect the market weighted average returns of stocks that currently trade on French exchanges.
Valuation is complex, but we're helping make it simple.
Find out whether SEB is potentially over or undervalued by checking out our comprehensive analysis, which includes fair value estimates, risks and warnings, dividends, insider transactions and financial health.
View the Free AnalysisHave feedback on this article? Concerned about the content? Get in touch with us directly. Alternatively, email editorial-team (at) simplywallst.com.
This article by Simply Wall St is general in nature. We provide commentary based on historical data and analyst forecasts only using an unbiased methodology and our articles are not intended to be financial advice. It does not constitute a recommendation to buy or sell any stock, and does not take account of your objectives, or your financial situation. We aim to bring you long-term focused analysis driven by fundamental data. Note that our analysis may not factor in the latest price-sensitive company announcements or qualitative material. Simply Wall St has no position in any stocks mentioned.
About ENXTPA:SK
SEB
SEB SA designs, manufactures, and markets small domestic equipment worldwide.
Excellent balance sheet with proven track record and pays a dividend.

