
Advertisement
- France
- /
- Consumer Durables
- /
- ENXTPA:SK
If You Had Bought SEB (EPA:SK) Stock Five Years Ago, You Could Pocket A 142% Gain Today
When you buy a stock there is always a possibility that it could drop 100%. But when you pick a company that is really flourishing, you can make more than 100%. For instance, the price of SEB SA (EPA:SK) stock is up an impressive 142% over the last five years. It's also good to see the share price up 35% over the last quarter. But this could be related to the strong market, which is up 15% in the last three months.
Check out our latest analysis for SEB
To paraphrase Benjamin Graham: Over the short term the market is a voting machine, but over the long term it's a weighing machine. One flawed but reasonable way to assess how sentiment around a company has changed is to compare the earnings per share (EPS) with the share price.
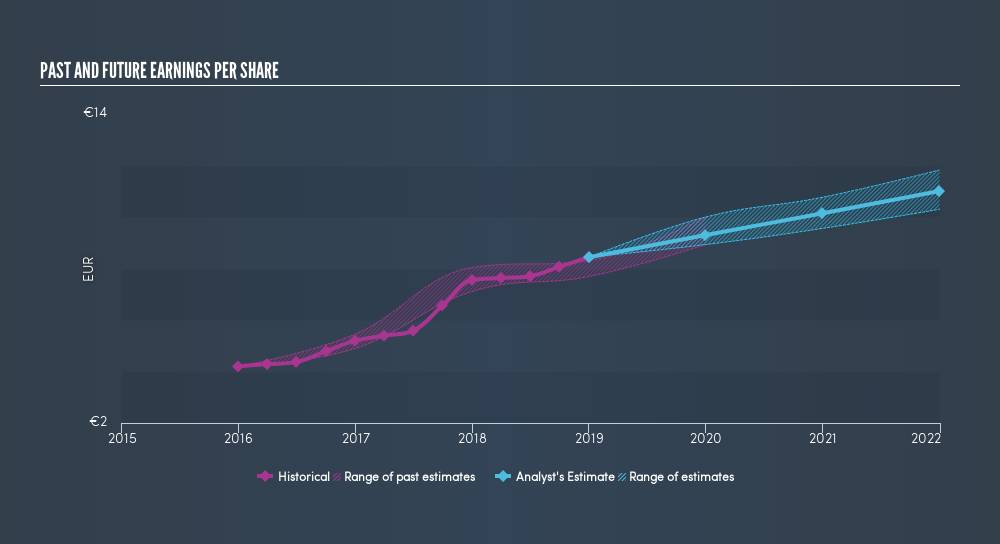
During five years of share price growth, SEB achieved compound earnings per share (EPS) growth of 15% per year. This EPS growth is slower than the share price growth of 19% per year, over the same period. So it's fair to assume the market has a higher opinion of the business than it did five years ago. And that's hardly shocking given the track record of growth.
You can see how EPS has changed over time in the image below (click on the chart to see the exact values).
We know that SEB has improved its bottom line lately, but is it going to grow revenue? This freereport showing analyst revenue forecasts should help you figure out if the EPS growth can be sustained.
What About Dividends?
When looking at investment returns, it is important to consider the difference between total shareholder return (TSR) and share price return. The TSR is a return calculation that accounts for the value of cash dividends (assuming that any dividend received was reinvested) and the calculated value of any discounted capital raisings and spin-offs. So for companies that pay a generous dividend, the TSR is often a lot higher than the share price return. As it happens, SEB's TSR for the last 5 years was 162%, which exceeds the share price return mentioned earlier. And there's no prize for guessing that the dividend payments largely explain the divergence!
A Different Perspective
SEB shareholders are down 5.8% for the year (even including dividends), but the market itself is up 7.5%. Even the share prices of good stocks drop sometimes, but we want to see improvements in the fundamental metrics of a business, before getting too interested. On the bright side, long term shareholders have made money, with a gain of 21% per year over half a decade. If the fundamental data continues to indicate long term sustainable growth, the current sell-off could be an opportunity worth considering. Before deciding if you like the current share price, check how SEB scores on these 3 valuation metrics.
If you would prefer to check out another company -- one with potentially superior financials -- then do not miss this freelist of companies that have proven they can grow earnings.
Please note, the market returns quoted in this article reflect the market weighted average returns of stocks that currently trade on FR exchanges.We aim to bring you long-term focused research analysis driven by fundamental data. Note that our analysis may not factor in the latest price-sensitive company announcements or qualitative material.
If you spot an error that warrants correction, please contact the editor at editorial-team@simplywallst.com. This article by Simply Wall St is general in nature. It does not constitute a recommendation to buy or sell any stock, and does not take account of your objectives, or your financial situation. Simply Wall St has no position in the stocks mentioned. Thank you for reading.
About ENXTPA:SK
SEB
Designs, manufactures, and markets small domestic equipment in Western Europe, rest of Europe, the Middle East, Africa, North and South America, China, and rest of Asia.
Moderate risk with adequate balance sheet.
Similar Companies
Market Insights

Advertisement
Community Narratives
The company that turned a verb into a global necessity and basically runs the modern internet, digital ads, smartphones, maps, and AI.
Fair Value US$300.00|7.1% undervalued
OS
Community Contributor
Flowers Foods Pays A Fair Price For Health
Fair Value US$16.12|26.4% undervalued
NV
Community Contributor
TMX Group will thrive with 33.3% profit margin and enduring market moat
Fair Value CA$49.90|0.8% overvalued
LI
Community Contributor
The "Molecular Pencil": Why Beam's Technology is Built to Win
Fair Value US$65.01|65.8% undervalued
DA
Community Contributor