Stock Analysis
- France
- /
- Auto Components
- /
- ENXTPA:BUR
Burelle (EPA:BUR) sheds €47m, company earnings and investor returns have been trending downwards for past five years

Statistically speaking, long term investing is a profitable endeavour. But along the way some stocks are going to perform badly. For example the Burelle SA (EPA:BUR) share price dropped 59% over five years. That's not a lot of fun for true believers. We also note that the stock has performed poorly over the last year, with the share price down 23%. The falls have accelerated recently, with the share price down 13% in the last three months.
With the stock having lost 6.5% in the past week, it's worth taking a look at business performance and seeing if there's any red flags.
Check out our latest analysis for Burelle
In his essay The Superinvestors of Graham-and-Doddsville Warren Buffett described how share prices do not always rationally reflect the value of a business. One imperfect but simple way to consider how the market perception of a company has shifted is to compare the change in the earnings per share (EPS) with the share price movement.
During five years of share price growth, Burelle moved from a loss to profitability. Most would consider that to be a good thing, so it's counter-intuitive to see the share price declining. Other metrics may better explain the share price move.
The steady dividend doesn't really explain why the share price is down. While it's not completely obvious why the share price is down, a closer look at the company's history might help explain it.
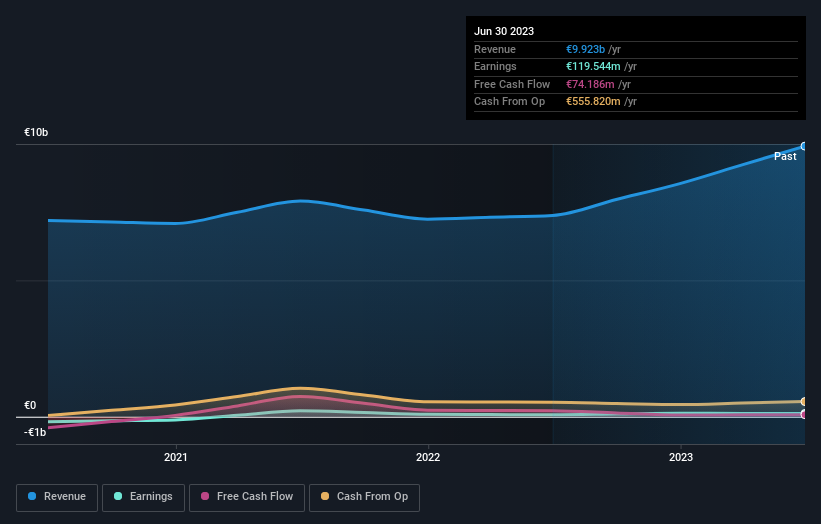
The company's revenue and earnings (over time) are depicted in the image below (click to see the exact numbers).
This free interactive report on Burelle's balance sheet strength is a great place to start, if you want to investigate the stock further.
What About Dividends?
It is important to consider the total shareholder return, as well as the share price return, for any given stock. The TSR incorporates the value of any spin-offs or discounted capital raisings, along with any dividends, based on the assumption that the dividends are reinvested. It's fair to say that the TSR gives a more complete picture for stocks that pay a dividend. In the case of Burelle, it has a TSR of -54% for the last 5 years. That exceeds its share price return that we previously mentioned. This is largely a result of its dividend payments!
A Different Perspective
Investors in Burelle had a tough year, with a total loss of 20% (including dividends), against a market gain of about 2.3%. Even the share prices of good stocks drop sometimes, but we want to see improvements in the fundamental metrics of a business, before getting too interested. Regrettably, last year's performance caps off a bad run, with the shareholders facing a total loss of 9% per year over five years. Generally speaking long term share price weakness can be a bad sign, though contrarian investors might want to research the stock in hope of a turnaround. It's always interesting to track share price performance over the longer term. But to understand Burelle better, we need to consider many other factors. For instance, we've identified 3 warning signs for Burelle (1 can't be ignored) that you should be aware of.
If you are like me, then you will not want to miss this free list of growing companies that insiders are buying.
Please note, the market returns quoted in this article reflect the market weighted average returns of stocks that currently trade on French exchanges.
Valuation is complex, but we're helping make it simple.
Find out whether Burelle is potentially over or undervalued by checking out our comprehensive analysis, which includes fair value estimates, risks and warnings, dividends, insider transactions and financial health.
View the Free AnalysisHave feedback on this article? Concerned about the content? Get in touch with us directly. Alternatively, email editorial-team (at) simplywallst.com.
This article by Simply Wall St is general in nature. We provide commentary based on historical data and analyst forecasts only using an unbiased methodology and our articles are not intended to be financial advice. It does not constitute a recommendation to buy or sell any stock, and does not take account of your objectives, or your financial situation. We aim to bring you long-term focused analysis driven by fundamental data. Note that our analysis may not factor in the latest price-sensitive company announcements or qualitative material. Simply Wall St has no position in any stocks mentioned.
About ENXTPA:BUR
Burelle
Burelle SA, through its subsidiaries, offers automotive equipment, intelligent body systems, and clean energy systems and modules in France and internationally.
Good value average dividend payer.
