- Spain
- /
- Construction
- /
- BME:MDF
Duro Felguera, S.A. (BME:MDF) Earns Among The Best Returns In Its Industry


Today we'll look at Duro Felguera, S.A. (BME:MDF) and reflect on its potential as an investment. To be precise, we'll consider its Return On Capital Employed (ROCE), as that will inform our view of the quality of the business.
First, we'll go over how we calculate ROCE. Second, we'll look at its ROCE compared to similar companies. Last but not least, we'll look at what impact its current liabilities have on its ROCE.
What is Return On Capital Employed (ROCE)?
ROCE measures the amount of pre-tax profits a company can generate from the capital employed in its business. Generally speaking a higher ROCE is better. Overall, it is a valuable metric that has its flaws. Renowned investment researcher Michael Mauboussin has suggested that a high ROCE can indicate that 'one dollar invested in the company generates value of more than one dollar'.
So, How Do We Calculate ROCE?
Analysts use this formula to calculate return on capital employed:
Return on Capital Employed = Earnings Before Interest and Tax (EBIT) ÷ (Total Assets - Current Liabilities)
Or for Duro Felguera:
0.10 = €15m ÷ (€471m - €326m) (Based on the trailing twelve months to December 2019.)
So, Duro Felguera has an ROCE of 10%.
View our latest analysis for Duro Felguera
Does Duro Felguera Have A Good ROCE?
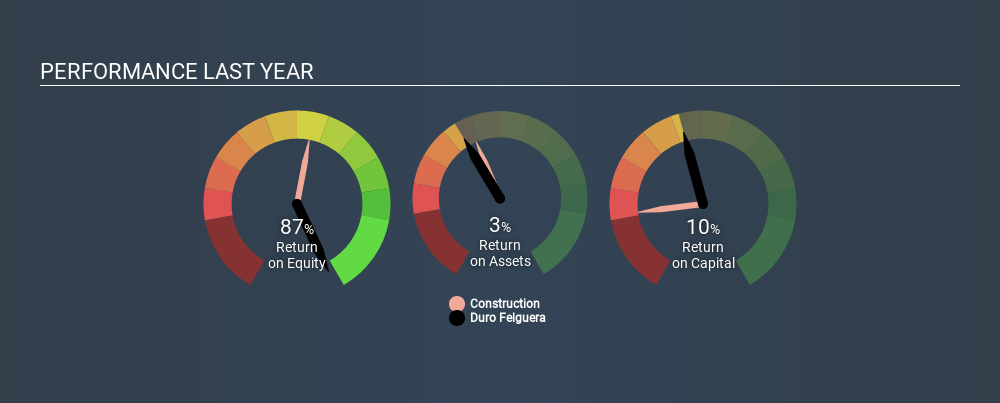
ROCE is commonly used for comparing the performance of similar businesses. Duro Felguera's ROCE appears to be substantially greater than the 6.1% average in the Construction industry. We consider this a positive sign, because it suggests it uses capital more efficiently than similar companies. Independently of how Duro Felguera compares to its industry, its ROCE in absolute terms appears decent, and the company may be worthy of closer investigation.
We can see that, Duro Felguera currently has an ROCE of 10% compared to its ROCE 3 years ago, which was 0.3%. This makes us wonder if the company is improving. You can see in the image below how Duro Felguera's ROCE compares to its industry. Click to see more on past growth.
When considering ROCE, bear in mind that it reflects the past and does not necessarily predict the future. Companies in cyclical industries can be difficult to understand using ROCE, as returns typically look high during boom times, and low during busts. ROCE is only a point-in-time measure. If Duro Felguera is cyclical, it could make sense to check out this free graph of past earnings, revenue and cash flow.
Duro Felguera's Current Liabilities And Their Impact On Its ROCE
Liabilities, such as supplier bills and bank overdrafts, are referred to as current liabilities if they need to be paid within 12 months. The ROCE equation subtracts current liabilities from capital employed, so a company with a lot of current liabilities appears to have less capital employed, and a higher ROCE than otherwise. To check the impact of this, we calculate if a company has high current liabilities relative to its total assets.
Duro Felguera has current liabilities of €326m and total assets of €471m. Therefore its current liabilities are equivalent to approximately 69% of its total assets. Duro Felguera has a relatively high level of current liabilities, boosting its ROCE meaningfully.
Our Take On Duro Felguera's ROCE
This ROCE is pretty good, but remember that it would look less impressive with fewer current liabilities. Duro Felguera shapes up well under this analysis, but it is far from the only business delivering excellent numbers . You might also want to check this free collection of companies delivering excellent earnings growth.
I will like Duro Felguera better if I see some big insider buys. While we wait, check out this free list of growing companies with considerable, recent, insider buying.
If you spot an error that warrants correction, please contact the editor at editorial-team@simplywallst.com. This article by Simply Wall St is general in nature. It does not constitute a recommendation to buy or sell any stock, and does not take account of your objectives, or your financial situation. Simply Wall St has no position in the stocks mentioned.
We aim to bring you long-term focused research analysis driven by fundamental data. Note that our analysis may not factor in the latest price-sensitive company announcements or qualitative material. Thank you for reading.
About BME:MDF
Duro Felguera
Duro Felguera, S.A. executes turnkey projects for the energy and industrial sectors in Spain, Latin America, Europe, Africa, the Middle East, Pacific Asia, and internationally.
Low and slightly overvalued.

