Stock Analysis
- Denmark
- /
- Entertainment
- /
- CPSE:BIF
Brøndbyernes IF Fodbold (CPH:BIF) delivers shareholders notable 40% return over 1 year, surging 12% in the last week alone


If you want to compound wealth in the stock market, you can do so by buying an index fund. But you can significantly boost your returns by picking above-average stocks. For example, the Brøndbyernes IF Fodbold A/S (CPH:BIF) share price is up 40% in the last 1 year, clearly besting the market return of around 28% (not including dividends). So that should have shareholders smiling. Looking back further, the stock price is 35% higher than it was three years ago.
Since the stock has added kr.41m to its market cap in the past week alone, let's see if underlying performance has been driving long-term returns.
See our latest analysis for Brøndbyernes IF Fodbold
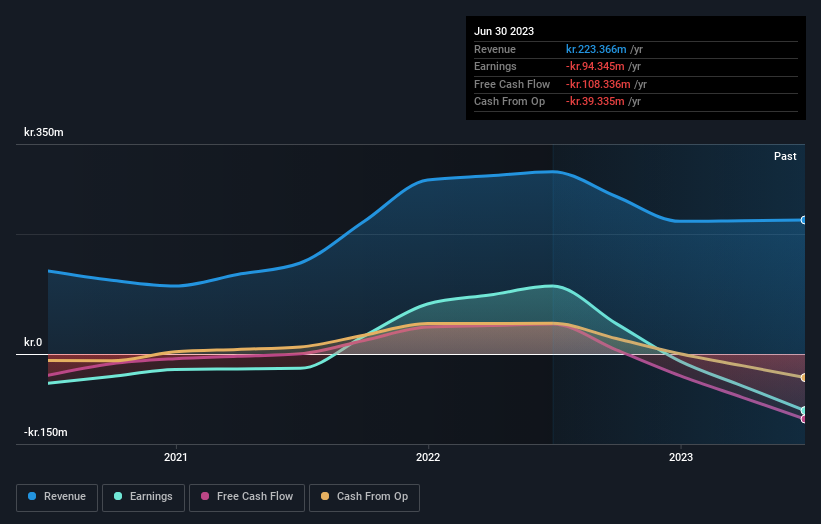
Brøndbyernes IF Fodbold wasn't profitable in the last twelve months, it is unlikely we'll see a strong correlation between its share price and its earnings per share (EPS). Arguably revenue is our next best option. When a company doesn't make profits, we'd generally expect to see good revenue growth. Some companies are willing to postpone profitability to grow revenue faster, but in that case one does expect good top-line growth.
In the last year Brøndbyernes IF Fodbold saw its revenue shrink by 26%. The stock is up 40% in that time, a fine performance given the revenue drop. To us that means that there isn't a lot of correlation between the past revenue performance and the share price, but a closer look at analyst forecasts and the bottom line may well explain a lot.
The graphic below depicts how earnings and revenue have changed over time (unveil the exact values by clicking on the image).
Take a more thorough look at Brøndbyernes IF Fodbold's financial health with this free report on its balance sheet.
A Different Perspective
It's good to see that Brøndbyernes IF Fodbold has rewarded shareholders with a total shareholder return of 40% in the last twelve months. Notably the five-year annualised TSR loss of 1.2% per year compares very unfavourably with the recent share price performance. The long term loss makes us cautious, but the short term TSR gain certainly hints at a brighter future. It's always interesting to track share price performance over the longer term. But to understand Brøndbyernes IF Fodbold better, we need to consider many other factors. To that end, you should be aware of the 1 warning sign we've spotted with Brøndbyernes IF Fodbold .
If you would prefer to check out another company -- one with potentially superior financials -- then do not miss this free list of companies that have proven they can grow earnings.
Please note, the market returns quoted in this article reflect the market weighted average returns of stocks that currently trade on Danish exchanges.
Valuation is complex, but we're helping make it simple.
Find out whether Brøndbyernes IF Fodbold is potentially over or undervalued by checking out our comprehensive analysis, which includes fair value estimates, risks and warnings, dividends, insider transactions and financial health.
View the Free AnalysisHave feedback on this article? Concerned about the content? Get in touch with us directly. Alternatively, email editorial-team (at) simplywallst.com.
This article by Simply Wall St is general in nature. We provide commentary based on historical data and analyst forecasts only using an unbiased methodology and our articles are not intended to be financial advice. It does not constitute a recommendation to buy or sell any stock, and does not take account of your objectives, or your financial situation. We aim to bring you long-term focused analysis driven by fundamental data. Note that our analysis may not factor in the latest price-sensitive company announcements or qualitative material. Simply Wall St has no position in any stocks mentioned.
About CPSE:BIF
Brøndbyernes IF Fodbold
Operates the Brøndbyernes Idrætsforening football club in Denmark.
Low and slightly overvalued.
