- Denmark
- /
- Construction
- /
- CPSE:PAAL B
Per Aarsleff Holding's (CPH:PAAL B) five-year earnings growth trails the respectable shareholder returns


The main point of investing for the long term is to make money. But more than that, you probably want to see it rise more than the market average. But Per Aarsleff Holding A/S (CPH:PAAL B) has fallen short of that second goal, with a share price rise of 63% over five years, which is below the market return. Over the last twelve months the stock price has risen a very respectable 20%.
Since it's been a strong week for Per Aarsleff Holding shareholders, let's have a look at trend of the longer term fundamentals.
See our latest analysis for Per Aarsleff Holding
To quote Buffett, 'Ships will sail around the world but the Flat Earth Society will flourish. There will continue to be wide discrepancies between price and value in the marketplace...' One flawed but reasonable way to assess how sentiment around a company has changed is to compare the earnings per share (EPS) with the share price.
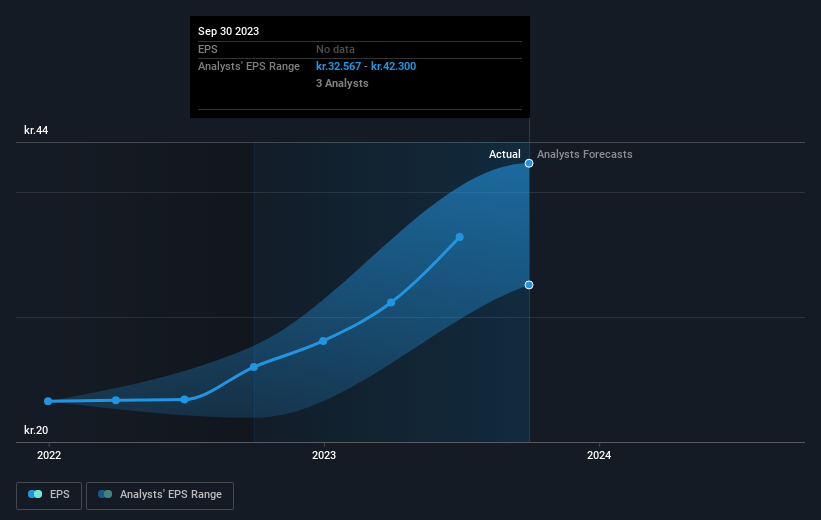
During five years of share price growth, Per Aarsleff Holding achieved compound earnings per share (EPS) growth of 20% per year. This EPS growth is higher than the 10% average annual increase in the share price. So one could conclude that the broader market has become more cautious towards the stock. The reasonably low P/E ratio of 8.18 also suggests market apprehension.
The image below shows how EPS has tracked over time (if you click on the image you can see greater detail).
We know that Per Aarsleff Holding has improved its bottom line over the last three years, but what does the future have in store? You can see how its balance sheet has strengthened (or weakened) over time in this free interactive graphic.
What About Dividends?
As well as measuring the share price return, investors should also consider the total shareholder return (TSR). The TSR is a return calculation that accounts for the value of cash dividends (assuming that any dividend received was reinvested) and the calculated value of any discounted capital raisings and spin-offs. Arguably, the TSR gives a more comprehensive picture of the return generated by a stock. We note that for Per Aarsleff Holding the TSR over the last 5 years was 85%, which is better than the share price return mentioned above. The dividends paid by the company have thusly boosted the total shareholder return.
A Different Perspective
Per Aarsleff Holding provided a TSR of 23% over the last twelve months. Unfortunately this falls short of the market return. On the bright side, that's still a gain, and it's actually better than the average return of 13% over half a decade This suggests the company might be improving over time. I find it very interesting to look at share price over the long term as a proxy for business performance. But to truly gain insight, we need to consider other information, too. Consider for instance, the ever-present spectre of investment risk. We've identified 2 warning signs with Per Aarsleff Holding (at least 1 which is a bit concerning) , and understanding them should be part of your investment process.
For those who like to find winning investments this free list of growing companies with recent insider purchasing, could be just the ticket.
Please note, the market returns quoted in this article reflect the market weighted average returns of stocks that currently trade on Danish exchanges.
New: Manage All Your Stock Portfolios in One Place
We've created the ultimate portfolio companion for stock investors, and it's free.
• Connect an unlimited number of Portfolios and see your total in one currency
• Be alerted to new Warning Signs or Risks via email or mobile
• Track the Fair Value of your stocks
Have feedback on this article? Concerned about the content? Get in touch with us directly. Alternatively, email editorial-team (at) simplywallst.com.
This article by Simply Wall St is general in nature. We provide commentary based on historical data and analyst forecasts only using an unbiased methodology and our articles are not intended to be financial advice. It does not constitute a recommendation to buy or sell any stock, and does not take account of your objectives, or your financial situation. We aim to bring you long-term focused analysis driven by fundamental data. Note that our analysis may not factor in the latest price-sensitive company announcements or qualitative material. Simply Wall St has no position in any stocks mentioned.
About CPSE:PAAL B
Per Aarsleff Holding
Engages in the construction and maintenance of infrastructure and building structures of society in Denmark and internationally.
Flawless balance sheet, undervalued and pays a dividend.

