Stock Analysis
Sydbank's (CPH:SYDB) five-year earnings growth trails the impressive shareholder returns

The worst result, after buying shares in a company (assuming no leverage), would be if you lose all the money you put in. But when you pick a company that is really flourishing, you can make more than 100%. For example, the Sydbank A/S (CPH:SYDB) share price has soared 158% in the last half decade. Most would be very happy with that. On top of that, the share price is up 24% in about a quarter. But this move may well have been assisted by the reasonably buoyant market (up 12% in 90 days).
After a strong gain in the past week, it's worth seeing if longer term returns have been driven by improving fundamentals.
Check out our latest analysis for Sydbank
While markets are a powerful pricing mechanism, share prices reflect investor sentiment, not just underlying business performance. One flawed but reasonable way to assess how sentiment around a company has changed is to compare the earnings per share (EPS) with the share price.
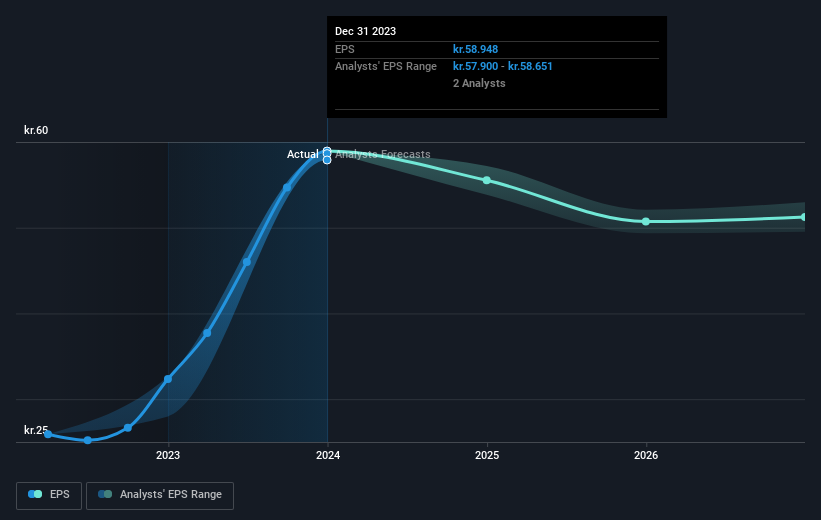
Over half a decade, Sydbank managed to grow its earnings per share at 28% a year. This EPS growth is higher than the 21% average annual increase in the share price. Therefore, it seems the market has become relatively pessimistic about the company. The reasonably low P/E ratio of 6.07 also suggests market apprehension.
You can see how EPS has changed over time in the image below (click on the chart to see the exact values).
We consider it positive that insiders have made significant purchases in the last year. Having said that, most people consider earnings and revenue growth trends to be a more meaningful guide to the business. This free interactive report on Sydbank's earnings, revenue and cash flow is a great place to start, if you want to investigate the stock further.
What About Dividends?
When looking at investment returns, it is important to consider the difference between total shareholder return (TSR) and share price return. Whereas the share price return only reflects the change in the share price, the TSR includes the value of dividends (assuming they were reinvested) and the benefit of any discounted capital raising or spin-off. It's fair to say that the TSR gives a more complete picture for stocks that pay a dividend. We note that for Sydbank the TSR over the last 5 years was 227%, which is better than the share price return mentioned above. This is largely a result of its dividend payments!
A Different Perspective
It's good to see that Sydbank has rewarded shareholders with a total shareholder return of 36% in the last twelve months. That's including the dividend. That gain is better than the annual TSR over five years, which is 27%. Therefore it seems like sentiment around the company has been positive lately. Given the share price momentum remains strong, it might be worth taking a closer look at the stock, lest you miss an opportunity. I find it very interesting to look at share price over the long term as a proxy for business performance. But to truly gain insight, we need to consider other information, too. Take risks, for example - Sydbank has 2 warning signs (and 1 which doesn't sit too well with us) we think you should know about.
Sydbank is not the only stock insiders are buying. So take a peek at this free list of growing companies with insider buying.
Please note, the market returns quoted in this article reflect the market weighted average returns of stocks that currently trade on Danish exchanges.
Valuation is complex, but we're helping make it simple.
Find out whether Sydbank is potentially over or undervalued by checking out our comprehensive analysis, which includes fair value estimates, risks and warnings, dividends, insider transactions and financial health.
View the Free AnalysisHave feedback on this article? Concerned about the content? Get in touch with us directly. Alternatively, email editorial-team (at) simplywallst.com.
This article by Simply Wall St is general in nature. We provide commentary based on historical data and analyst forecasts only using an unbiased methodology and our articles are not intended to be financial advice. It does not constitute a recommendation to buy or sell any stock, and does not take account of your objectives, or your financial situation. We aim to bring you long-term focused analysis driven by fundamental data. Note that our analysis may not factor in the latest price-sensitive company announcements or qualitative material. Simply Wall St has no position in any stocks mentioned.
About CPSE:SYDB
Sydbank
Sydbank A/S, together with its subsidiaries, provides various banking products and services to corporate, private, retail, and institutional clients in Denmark and internationally.
Flawless balance sheet, undervalued and pays a dividend.
