Stock Analysis
- Germany
- /
- Wireless Telecom
- /
- XTRA:FNTN
freenet AG (ETR:FNTN) Has Fared Decently But Fundamentals Look Uncertain: What Lies Ahead For The Stock?


Most readers would already know that freenet's (ETR:FNTN) stock increased by 3.8% over the past month. However, we decided to study the company's mixed-bag of fundamentals to assess what this could mean for future share prices, as stock prices tend to be aligned with a company's long-term financial performance. Particularly, we will be paying attention to freenet's ROE today.
Return on Equity or ROE is a test of how effectively a company is growing its value and managing investors’ money. In other words, it is a profitability ratio which measures the rate of return on the capital provided by the company's shareholders.
View our latest analysis for freenet
How Do You Calculate Return On Equity?
The formula for return on equity is:
Return on Equity = Net Profit (from continuing operations) ÷ Shareholders' Equity
So, based on the above formula, the ROE for freenet is:
14% = €203m ÷ €1.5b (Based on the trailing twelve months to March 2024).
The 'return' is the profit over the last twelve months. One way to conceptualize this is that for each €1 of shareholders' capital it has, the company made €0.14 in profit.
Why Is ROE Important For Earnings Growth?
Thus far, we have learned that ROE measures how efficiently a company is generating its profits. Depending on how much of these profits the company reinvests or "retains", and how effectively it does so, we are then able to assess a company’s earnings growth potential. Assuming everything else remains unchanged, the higher the ROE and profit retention, the higher the growth rate of a company compared to companies that don't necessarily bear these characteristics.
A Side By Side comparison of freenet's Earnings Growth And 14% ROE
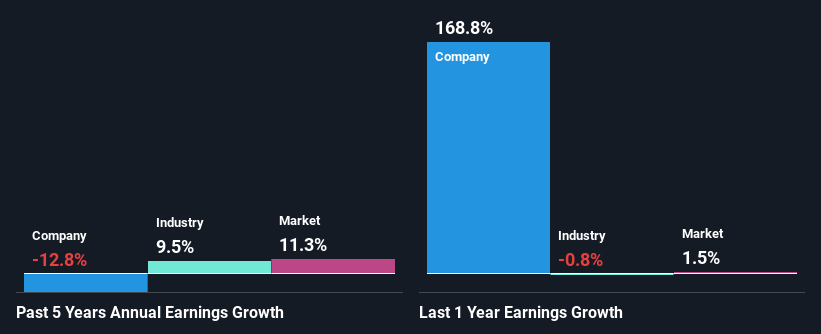
To begin with, freenet seems to have a respectable ROE. Further, the company's ROE compares quite favorably to the industry average of 5.1%. As you might expect, the 13% net income decline reported by freenet is a bit of a surprise. We reckon that there could be some other factors at play here that are preventing the company's growth. For example, it could be that the company has a high payout ratio or the business has allocated capital poorly, for instance.
However, when we compared freenet's growth with the industry we found that while the company's earnings have been shrinking, the industry has seen an earnings growth of 9.5% in the same period. This is quite worrisome.
The basis for attaching value to a company is, to a great extent, tied to its earnings growth. What investors need to determine next is if the expected earnings growth, or the lack of it, is already built into the share price. Doing so will help them establish if the stock's future looks promising or ominous. Is freenet fairly valued compared to other companies? These 3 valuation measures might help you decide.
Is freenet Making Efficient Use Of Its Profits?
freenet's high three-year median payout ratio of 116% suggests that the company is depleting its resources to keep up its dividend payments, and this shows in its shrinking earnings. Paying a dividend beyond their means is usually not viable over the long term.
In addition, freenet has been paying dividends over a period of at least ten years suggesting that keeping up dividend payments is way more important to the management even if it comes at the cost of business growth. Our latest analyst data shows that the future payout ratio of the company is expected to drop to 87% over the next three years. As a result, the expected drop in freenet's payout ratio explains the anticipated rise in the company's future ROE to 18%, over the same period.
Conclusion
Overall, we have mixed feelings about freenet. Despite the high ROE, the company has a disappointing earnings growth number, due to its poor rate of reinvestment into its business. Having said that, looking at current analyst estimates, we found that the company's earnings growth rate is expected to see a huge improvement. To know more about the latest analysts predictions for the company, check out this visualization of analyst forecasts for the company.
Valuation is complex, but we're helping make it simple.
Find out whether freenet is potentially over or undervalued by checking out our comprehensive analysis, which includes fair value estimates, risks and warnings, dividends, insider transactions and financial health.
View the Free AnalysisHave feedback on this article? Concerned about the content? Get in touch with us directly. Alternatively, email editorial-team (at) simplywallst.com.
This article by Simply Wall St is general in nature. We provide commentary based on historical data and analyst forecasts only using an unbiased methodology and our articles are not intended to be financial advice. It does not constitute a recommendation to buy or sell any stock, and does not take account of your objectives, or your financial situation. We aim to bring you long-term focused analysis driven by fundamental data. Note that our analysis may not factor in the latest price-sensitive company announcements or qualitative material. Simply Wall St has no position in any stocks mentioned.
Valuation is complex, but we're helping make it simple.
Find out whether freenet is potentially over or undervalued by checking out our comprehensive analysis, which includes fair value estimates, risks and warnings, dividends, insider transactions and financial health.
View the Free AnalysisHave feedback on this article? Concerned about the content? Get in touch with us directly. Alternatively, email editorial-team@simplywallst.com
About XTRA:FNTN
freenet
Provides telecommunications, radio and multimedia, mobile communications, mobile Internet, and digital lifestyle services in Germany.
Undervalued with proven track record and pays a dividend.
