

The external fund manager backed by Berkshire Hathaway's Charlie Munger, Li Lu, makes no bones about it when he says 'The biggest investment risk is not the volatility of prices, but whether you will suffer a permanent loss of capital.' When we think about how risky a company is, we always like to look at its use of debt, since debt overload can lead to ruin. We can see that SAP SE (ETR:SAP) does use debt in its business. But the more important question is: how much risk is that debt creating?
When Is Debt A Problem?
Debt and other liabilities become risky for a business when it cannot easily fulfill those obligations, either with free cash flow or by raising capital at an attractive price. Part and parcel of capitalism is the process of 'creative destruction' where failed businesses are mercilessly liquidated by their bankers. However, a more usual (but still expensive) situation is where a company must dilute shareholders at a cheap share price simply to get debt under control. Of course, the upside of debt is that it often represents cheap capital, especially when it replaces dilution in a company with the ability to reinvest at high rates of return. When we think about a company's use of debt, we first look at cash and debt together.
Check out our latest analysis for SAP
What Is SAP's Debt?
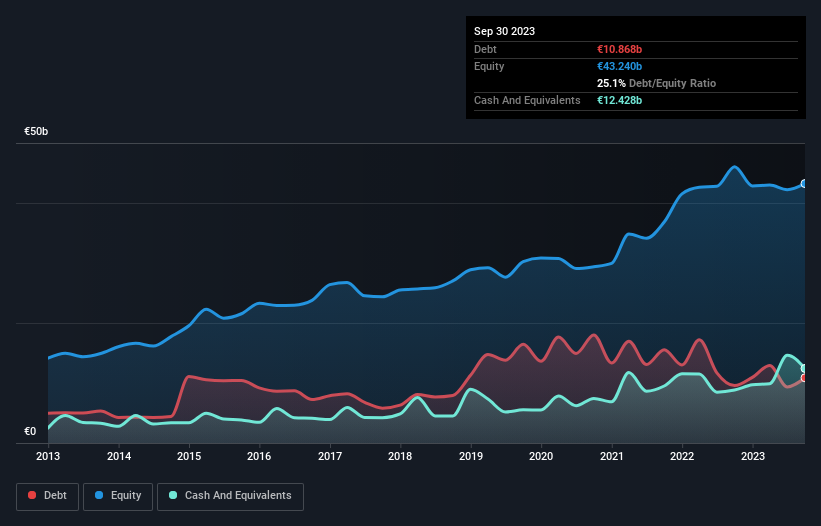
As you can see below, at the end of September 2023, SAP had €10.9b of debt, up from €9.57b a year ago. Click the image for more detail. However, it does have €12.4b in cash offsetting this, leading to net cash of €1.56b.
A Look At SAP's Liabilities
The latest balance sheet data shows that SAP had liabilities of €13.4b due within a year, and liabilities of €11.4b falling due after that. Offsetting this, it had €12.4b in cash and €6.02b in receivables that were due within 12 months. So it has liabilities totalling €6.33b more than its cash and near-term receivables, combined.
Of course, SAP has a titanic market capitalization of €172.5b, so these liabilities are probably manageable. But there are sufficient liabilities that we would certainly recommend shareholders continue to monitor the balance sheet, going forward. Despite its noteworthy liabilities, SAP boasts net cash, so it's fair to say it does not have a heavy debt load!
But the bad news is that SAP has seen its EBIT plunge 15% in the last twelve months. We think hat kind of performance, if repeated frequently, could well lead to difficulties for the stock. There's no doubt that we learn most about debt from the balance sheet. But it is future earnings, more than anything, that will determine SAP's ability to maintain a healthy balance sheet going forward. So if you want to see what the professionals think, you might find this free report on analyst profit forecasts to be interesting.
Finally, a company can only pay off debt with cold hard cash, not accounting profits. While SAP has net cash on its balance sheet, it's still worth taking a look at its ability to convert earnings before interest and tax (EBIT) to free cash flow, to help us understand how quickly it is building (or eroding) that cash balance. During the last three years, SAP generated free cash flow amounting to a very robust 90% of its EBIT, more than we'd expect. That positions it well to pay down debt if desirable to do so.
Summing Up
We could understand if investors are concerned about SAP's liabilities, but we can be reassured by the fact it has has net cash of €1.56b. And it impressed us with free cash flow of €5.6b, being 90% of its EBIT. So we don't have any problem with SAP's use of debt. The balance sheet is clearly the area to focus on when you are analysing debt. However, not all investment risk resides within the balance sheet - far from it. Be aware that SAP is showing 1 warning sign in our investment analysis , you should know about...
At the end of the day, it's often better to focus on companies that are free from net debt. You can access our special list of such companies (all with a track record of profit growth). It's free.
New: Manage All Your Stock Portfolios in One Place
We've created the ultimate portfolio companion for stock investors, and it's free.
• Connect an unlimited number of Portfolios and see your total in one currency
• Be alerted to new Warning Signs or Risks via email or mobile
• Track the Fair Value of your stocks
Have feedback on this article? Concerned about the content? Get in touch with us directly. Alternatively, email editorial-team (at) simplywallst.com.
This article by Simply Wall St is general in nature. We provide commentary based on historical data and analyst forecasts only using an unbiased methodology and our articles are not intended to be financial advice. It does not constitute a recommendation to buy or sell any stock, and does not take account of your objectives, or your financial situation. We aim to bring you long-term focused analysis driven by fundamental data. Note that our analysis may not factor in the latest price-sensitive company announcements or qualitative material. Simply Wall St has no position in any stocks mentioned.
About XTRA:SAP
Flawless balance sheet with reasonable growth potential.
