- Germany
- /
- Capital Markets
- /
- XTRA:B7E
Blue Cap (ETR:B7E investor one-year losses grow to 25% as the stock sheds €13m this past week


The simplest way to benefit from a rising market is to buy an index fund. Active investors aim to buy stocks that vastly outperform the market - but in the process, they risk under-performance. Unfortunately the Blue Cap AG (ETR:B7E) share price slid 28% over twelve months. That's disappointing when you consider the market returned 8.9%. Longer term shareholders haven't suffered as badly, since the stock is down a comparatively less painful 5.2% in three years. The share price has dropped 32% in three months. We note that the company has reported results fairly recently; and the market is hardly delighted. You can check out the latest numbers in our company report.
With the stock having lost 16% in the past week, it's worth taking a look at business performance and seeing if there's any red flags.
See our latest analysis for Blue Cap
To quote Buffett, 'Ships will sail around the world but the Flat Earth Society will flourish. There will continue to be wide discrepancies between price and value in the marketplace...' By comparing earnings per share (EPS) and share price changes over time, we can get a feel for how investor attitudes to a company have morphed over time.
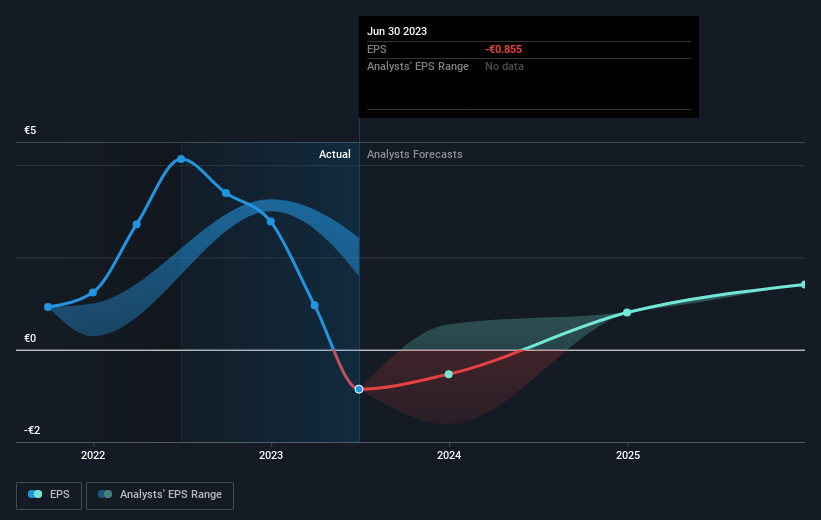
During the last year Blue Cap saw its earnings per share drop below zero. Buyers no doubt think it's a temporary situation, but those with a nose for quality have low tolerance for losses. We hope for shareholders' sake that the company becomes profitable again soon.
The image below shows how EPS has tracked over time (if you click on the image you can see greater detail).
It's probably worth noting that the CEO is paid less than the median at similar sized companies. It's always worth keeping an eye on CEO pay, but a more important question is whether the company will grow earnings throughout the years. This free interactive report on Blue Cap's earnings, revenue and cash flow is a great place to start, if you want to investigate the stock further.
What About Dividends?
As well as measuring the share price return, investors should also consider the total shareholder return (TSR). Whereas the share price return only reflects the change in the share price, the TSR includes the value of dividends (assuming they were reinvested) and the benefit of any discounted capital raising or spin-off. Arguably, the TSR gives a more comprehensive picture of the return generated by a stock. We note that for Blue Cap the TSR over the last 1 year was -25%, which is better than the share price return mentioned above. And there's no prize for guessing that the dividend payments largely explain the divergence!
A Different Perspective
While the broader market gained around 8.9% in the last year, Blue Cap shareholders lost 25% (even including dividends). Even the share prices of good stocks drop sometimes, but we want to see improvements in the fundamental metrics of a business, before getting too interested. Unfortunately, last year's performance may indicate unresolved challenges, given that it was worse than the annualised loss of 0.8% over the last half decade. Generally speaking long term share price weakness can be a bad sign, though contrarian investors might want to research the stock in hope of a turnaround. It's always interesting to track share price performance over the longer term. But to understand Blue Cap better, we need to consider many other factors. For instance, we've identified 3 warning signs for Blue Cap that you should be aware of.
If you like to buy stocks alongside management, then you might just love this free list of companies. (Hint: insiders have been buying them).
Please note, the market returns quoted in this article reflect the market weighted average returns of stocks that currently trade on German exchanges.
Valuation is complex, but we're here to simplify it.
Discover if Blue Cap might be undervalued or overvalued with our detailed analysis, featuring fair value estimates, potential risks, dividends, insider trades, and its financial condition.
Access Free AnalysisHave feedback on this article? Concerned about the content? Get in touch with us directly. Alternatively, email editorial-team (at) simplywallst.com.
This article by Simply Wall St is general in nature. We provide commentary based on historical data and analyst forecasts only using an unbiased methodology and our articles are not intended to be financial advice. It does not constitute a recommendation to buy or sell any stock, and does not take account of your objectives, or your financial situation. We aim to bring you long-term focused analysis driven by fundamental data. Note that our analysis may not factor in the latest price-sensitive company announcements or qualitative material. Simply Wall St has no position in any stocks mentioned.
About XTRA:B7E
Blue Cap
A private equity firm specializes in middle market, late stage, mature, turnaround, recapitalization, buyout, special situations, restructuring, corporate carve-out, and growth capital investments.
Reasonable growth potential with adequate balance sheet.
