- Germany
- /
- Food and Staples Retail
- /
- XTRA:B4B
Metro (ETR:B4B) shareholders are up 3.0% this past week, but still in the red over the last five years


We think intelligent long term investing is the way to go. But no-one is immune from buying too high. For example the Metro AG (ETR:B4B) share price dropped 69% over five years. That is extremely sub-optimal, to say the least. And it's not just long term holders hurting, because the stock is down 37% in the last year. Furthermore, it's down 12% in about a quarter. That's not much fun for holders.
On a more encouraging note the company has added €47m to its market cap in just the last 7 days, so let's see if we can determine what's driven the five-year loss for shareholders.
See our latest analysis for Metro
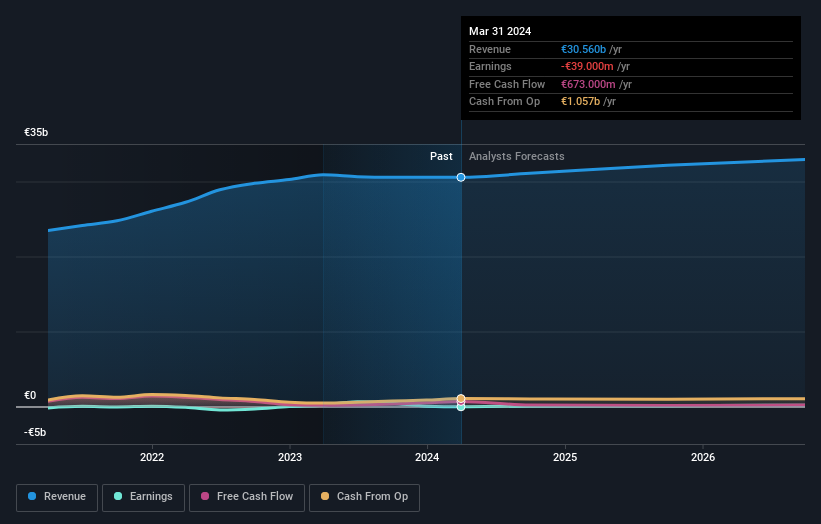
Metro wasn't profitable in the last twelve months, it is unlikely we'll see a strong correlation between its share price and its earnings per share (EPS). Arguably revenue is our next best option. Generally speaking, companies without profits are expected to grow revenue every year, and at a good clip. That's because fast revenue growth can be easily extrapolated to forecast profits, often of considerable size.
In the last half decade, Metro saw its revenue increase by 4.5% per year. That's not a very high growth rate considering it doesn't make profits. This lacklustre growth has no doubt fueled the loss of 11% per year, in that time. We'd want to see proof that future revenue growth is likely to be significantly stronger before getting too interested in Metro. When a stock falls hard like this, some investors like to add the company to a watchlist (in case the business recovers, longer term).
You can see below how earnings and revenue have changed over time (discover the exact values by clicking on the image).
If you are thinking of buying or selling Metro stock, you should check out this FREE detailed report on its balance sheet.
What About Dividends?
When looking at investment returns, it is important to consider the difference between total shareholder return (TSR) and share price return. The TSR is a return calculation that accounts for the value of cash dividends (assuming that any dividend received was reinvested) and the calculated value of any discounted capital raisings and spin-offs. Arguably, the TSR gives a more comprehensive picture of the return generated by a stock. As it happens, Metro's TSR for the last 5 years was -61%, which exceeds the share price return mentioned earlier. And there's no prize for guessing that the dividend payments largely explain the divergence!
A Different Perspective
Investors in Metro had a tough year, with a total loss of 31% (including dividends), against a market gain of about 6.0%. However, keep in mind that even the best stocks will sometimes underperform the market over a twelve month period. Regrettably, last year's performance caps off a bad run, with the shareholders facing a total loss of 10% per year over five years. We realise that Baron Rothschild has said investors should "buy when there is blood on the streets", but we caution that investors should first be sure they are buying a high quality business. It's always interesting to track share price performance over the longer term. But to understand Metro better, we need to consider many other factors. Consider for instance, the ever-present spectre of investment risk. We've identified 2 warning signs with Metro , and understanding them should be part of your investment process.
Of course, you might find a fantastic investment by looking elsewhere. So take a peek at this free list of companies we expect will grow earnings.
Please note, the market returns quoted in this article reflect the market weighted average returns of stocks that currently trade on German exchanges.
New: Manage All Your Stock Portfolios in One Place
We've created the ultimate portfolio companion for stock investors, and it's free.
• Connect an unlimited number of Portfolios and see your total in one currency
• Be alerted to new Warning Signs or Risks via email or mobile
• Track the Fair Value of your stocks
Have feedback on this article? Concerned about the content? Get in touch with us directly. Alternatively, email editorial-team (at) simplywallst.com.
This article by Simply Wall St is general in nature. We provide commentary based on historical data and analyst forecasts only using an unbiased methodology and our articles are not intended to be financial advice. It does not constitute a recommendation to buy or sell any stock, and does not take account of your objectives, or your financial situation. We aim to bring you long-term focused analysis driven by fundamental data. Note that our analysis may not factor in the latest price-sensitive company announcements or qualitative material. Simply Wall St has no position in any stocks mentioned.
About XTRA:B4B
Metro
Operates as a food wholesale company in Germany and internationally.
Fair value with moderate growth potential.

