Stock Analysis
- Germany
- /
- Industrials
- /
- XTRA:UUU
3U Holding's (ETR:UUU) five-year earnings growth trails the incredible shareholder returns

The last three months have been tough on 3U Holding AG (ETR:UUU) shareholders, who have seen the share price decline a rather worrying 51%. But that doesn't change the fact that shareholders have received really good returns over the last five years. In fact, the share price is 127% higher today. So while it's never fun to see a share price fall, it's important to look at a longer time horizon. Ultimately business performance will determine whether the stock price continues the positive long term trend.
The past week has proven to be lucrative for 3U Holding investors, so let's see if fundamentals drove the company's five-year performance.
Check out our latest analysis for 3U Holding
While the efficient markets hypothesis continues to be taught by some, it has been proven that markets are over-reactive dynamic systems, and investors are not always rational. One way to examine how market sentiment has changed over time is to look at the interaction between a company's share price and its earnings per share (EPS).
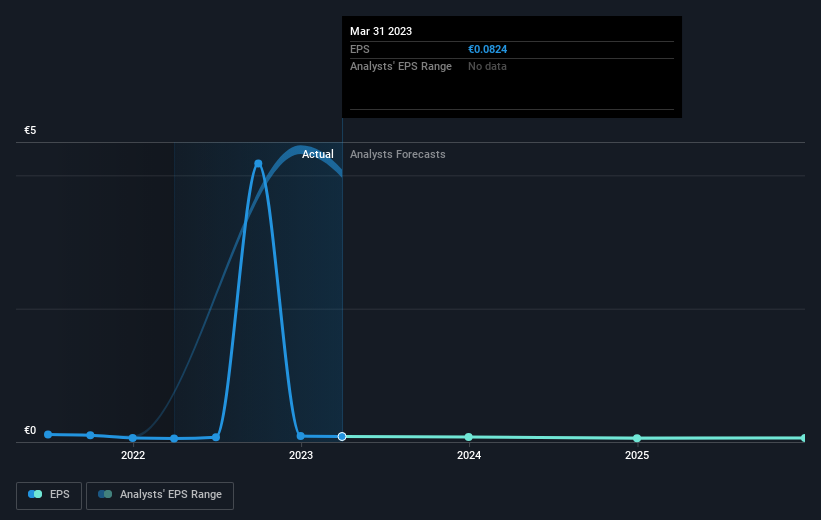
During five years of share price growth, 3U Holding achieved compound earnings per share (EPS) growth of 19% per year. So the EPS growth rate is rather close to the annualized share price gain of 18% per year. Therefore one could conclude that sentiment towards the shares hasn't morphed very much. Rather, the share price has approximately tracked EPS growth.
You can see how EPS has changed over time in the image below (click on the chart to see the exact values).
We know that 3U Holding has improved its bottom line lately, but is it going to grow revenue? You could check out this free report showing analyst revenue forecasts.
What About Dividends?
It is important to consider the total shareholder return, as well as the share price return, for any given stock. Whereas the share price return only reflects the change in the share price, the TSR includes the value of dividends (assuming they were reinvested) and the benefit of any discounted capital raising or spin-off. Arguably, the TSR gives a more comprehensive picture of the return generated by a stock. As it happens, 3U Holding's TSR for the last 5 years was 565%, which exceeds the share price return mentioned earlier. And there's no prize for guessing that the dividend payments largely explain the divergence!
A Different Perspective
We're pleased to report that 3U Holding shareholders have received a total shareholder return of 202% over one year. And that does include the dividend. Since the one-year TSR is better than the five-year TSR (the latter coming in at 46% per year), it would seem that the stock's performance has improved in recent times. In the best case scenario, this may hint at some real business momentum, implying that now could be a great time to delve deeper. I find it very interesting to look at share price over the long term as a proxy for business performance. But to truly gain insight, we need to consider other information, too. Like risks, for instance. Every company has them, and we've spotted 4 warning signs for 3U Holding (of which 2 make us uncomfortable!) you should know about.
If you like to buy stocks alongside management, then you might just love this free list of companies. (Hint: insiders have been buying them).
Please note, the market returns quoted in this article reflect the market weighted average returns of stocks that currently trade on German exchanges.
Valuation is complex, but we're helping make it simple.
Find out whether 3U Holding is potentially over or undervalued by checking out our comprehensive analysis, which includes fair value estimates, risks and warnings, dividends, insider transactions and financial health.
View the Free AnalysisHave feedback on this article? Concerned about the content? Get in touch with us directly. Alternatively, email editorial-team (at) simplywallst.com.
This article by Simply Wall St is general in nature. We provide commentary based on historical data and analyst forecasts only using an unbiased methodology and our articles are not intended to be financial advice. It does not constitute a recommendation to buy or sell any stock, and does not take account of your objectives, or your financial situation. We aim to bring you long-term focused analysis driven by fundamental data. Note that our analysis may not factor in the latest price-sensitive company announcements or qualitative material. Simply Wall St has no position in any stocks mentioned.
About XTRA:UUU
3U Holding
3U Holding AG, together with its subsidiaries, engages in the sale of sanitary, heating, and air conditioning technology products in Germany and internationally.
Excellent balance sheet with reasonable growth potential.

