- China
- /
- Renewable Energy
- /
- SZSE:000722
Despite the downward trend in earnings at Hunan Development Group (SZSE:000722) the stock rallies 9.1%, bringing five-year gains to 58%


Generally speaking the aim of active stock picking is to find companies that provide returns that are superior to the market average. Buying under-rated businesses is one path to excess returns. For example, long term Hunan Development Group Co., Ltd. (SZSE:000722) shareholders have enjoyed a 53% share price rise over the last half decade, well in excess of the market return of around 15% (not including dividends). However, more recent returns haven't been as impressive as that, with the stock returning just 7.5% in the last year, including dividends.
Since the stock has added CN¥404m to its market cap in the past week alone, let's see if underlying performance has been driving long-term returns.
View our latest analysis for Hunan Development Group
To quote Buffett, 'Ships will sail around the world but the Flat Earth Society will flourish. There will continue to be wide discrepancies between price and value in the marketplace...' One imperfect but simple way to consider how the market perception of a company has shifted is to compare the change in the earnings per share (EPS) with the share price movement.
During five years of share price growth, Hunan Development Group actually saw its EPS drop 16% per year.
This means it's unlikely the market is judging the company based on earnings growth. Since the change in EPS doesn't seem to correlate with the change in share price, it's worth taking a look at other metrics.
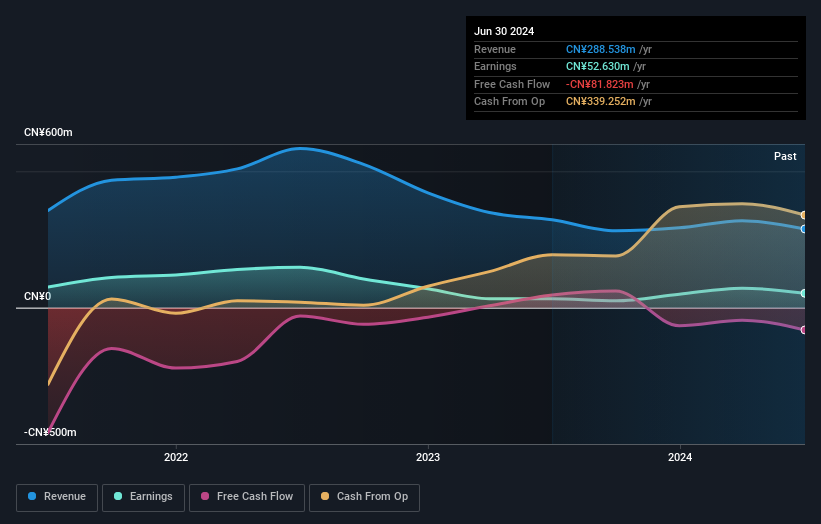
The modest 0.5% dividend yield is unlikely to be propping up the share price. On the other hand, Hunan Development Group's revenue is growing nicely, at a compound rate of 5.6% over the last five years. In that case, the company may be sacrificing current earnings per share to drive growth.
You can see below how earnings and revenue have changed over time (discover the exact values by clicking on the image).
If you are thinking of buying or selling Hunan Development Group stock, you should check out this FREE detailed report on its balance sheet.
What About Dividends?
As well as measuring the share price return, investors should also consider the total shareholder return (TSR). Whereas the share price return only reflects the change in the share price, the TSR includes the value of dividends (assuming they were reinvested) and the benefit of any discounted capital raising or spin-off. So for companies that pay a generous dividend, the TSR is often a lot higher than the share price return. We note that for Hunan Development Group the TSR over the last 5 years was 58%, which is better than the share price return mentioned above. The dividends paid by the company have thusly boosted the total shareholder return.
A Different Perspective
Hunan Development Group shareholders gained a total return of 7.5% during the year. Unfortunately this falls short of the market return. If we look back over five years, the returns are even better, coming in at 10% per year for five years. It may well be that this is a business worth popping on the watching, given the continuing positive reception, over time, from the market. I find it very interesting to look at share price over the long term as a proxy for business performance. But to truly gain insight, we need to consider other information, too. Take risks, for example - Hunan Development Group has 1 warning sign we think you should be aware of.
But note: Hunan Development Group may not be the best stock to buy. So take a peek at this free list of interesting companies with past earnings growth (and further growth forecast).
Please note, the market returns quoted in this article reflect the market weighted average returns of stocks that currently trade on Chinese exchanges.
Valuation is complex, but we're here to simplify it.
Discover if Hunan Development Group might be undervalued or overvalued with our detailed analysis, featuring fair value estimates, potential risks, dividends, insider trades, and its financial condition.
Access Free AnalysisHave feedback on this article? Concerned about the content? Get in touch with us directly. Alternatively, email editorial-team (at) simplywallst.com.
This article by Simply Wall St is general in nature. We provide commentary based on historical data and analyst forecasts only using an unbiased methodology and our articles are not intended to be financial advice. It does not constitute a recommendation to buy or sell any stock, and does not take account of your objectives, or your financial situation. We aim to bring you long-term focused analysis driven by fundamental data. Note that our analysis may not factor in the latest price-sensitive company announcements or qualitative material. Simply Wall St has no position in any stocks mentioned.
About SZSE:000722
Hunan Development Group
Engages in the development and operation of hydroelectric power generation in China.
Flawless balance sheet with proven track record.
