Stock Analysis
- China
- /
- Renewable Energy
- /
- SHSE:600795
Investors more bullish on GD Power DevelopmentLtd (SHSE:600795) this week as stock swells 11%, despite earnings trending downwards over past three years

The most you can lose on any stock (assuming you don't use leverage) is 100% of your money. But if you buy shares in a really great company, you can more than double your money. For example, the GD Power Development Co.,Ltd (SHSE:600795) share price has soared 140% in the last three years. How nice for those who held the stock! It's also good to see the share price up 18% over the last quarter.
Since it's been a strong week for GD Power DevelopmentLtd shareholders, let's have a look at trend of the longer term fundamentals.
Check out our latest analysis for GD Power DevelopmentLtd
To paraphrase Benjamin Graham: Over the short term the market is a voting machine, but over the long term it's a weighing machine. One way to examine how market sentiment has changed over time is to look at the interaction between a company's share price and its earnings per share (EPS).
During the three years of share price growth, GD Power DevelopmentLtd actually saw its earnings per share (EPS) drop 0.08% per year.
Based on these numbers, we think that the decline in earnings per share may not be a good representation of how the business has changed over the years. Since the change in EPS doesn't seem to correlate with the change in share price, it's worth taking a look at other metrics.
It could be that the revenue growth of 5.2% per year is viewed as evidence that GD Power DevelopmentLtd is growing. In that case, the company may be sacrificing current earnings per share to drive growth, and maybe shareholder's faith in better days ahead will be rewarded.
The company's revenue and earnings (over time) are depicted in the image below (click to see the exact numbers).

We know that GD Power DevelopmentLtd has improved its bottom line lately, but what does the future have in store? You can see what analysts are predicting for GD Power DevelopmentLtd in this interactive graph of future profit estimates.
What About Dividends?
When looking at investment returns, it is important to consider the difference between total shareholder return (TSR) and share price return. The TSR is a return calculation that accounts for the value of cash dividends (assuming that any dividend received was reinvested) and the calculated value of any discounted capital raisings and spin-offs. It's fair to say that the TSR gives a more complete picture for stocks that pay a dividend. In the case of GD Power DevelopmentLtd, it has a TSR of 154% for the last 3 years. That exceeds its share price return that we previously mentioned. And there's no prize for guessing that the dividend payments largely explain the divergence!
A Different Perspective
It's nice to see that GD Power DevelopmentLtd shareholders have received a total shareholder return of 59% over the last year. That's including the dividend. Since the one-year TSR is better than the five-year TSR (the latter coming in at 21% per year), it would seem that the stock's performance has improved in recent times. Someone with an optimistic perspective could view the recent improvement in TSR as indicating that the business itself is getting better with time. I find it very interesting to look at share price over the long term as a proxy for business performance. But to truly gain insight, we need to consider other information, too. For instance, we've identified 2 warning signs for GD Power DevelopmentLtd (1 is a bit unpleasant) that you should be aware of.
We will like GD Power DevelopmentLtd better if we see some big insider buys. While we wait, check out this free list of undervalued stocks (mostly small caps) with considerable, recent, insider buying.
Please note, the market returns quoted in this article reflect the market weighted average returns of stocks that currently trade on Chinese exchanges.
New: Manage All Your Stock Portfolios in One Place
We've created the ultimate portfolio companion for stock investors, and it's free.
• Connect an unlimited number of Portfolios and see your total in one currency
• Be alerted to new Warning Signs or Risks via email or mobile
• Track the Fair Value of your stocks
Have feedback on this article? Concerned about the content? Get in touch with us directly. Alternatively, email editorial-team (at) simplywallst.com.
This article by Simply Wall St is general in nature. We provide commentary based on historical data and analyst forecasts only using an unbiased methodology and our articles are not intended to be financial advice. It does not constitute a recommendation to buy or sell any stock, and does not take account of your objectives, or your financial situation. We aim to bring you long-term focused analysis driven by fundamental data. Note that our analysis may not factor in the latest price-sensitive company announcements or qualitative material. Simply Wall St has no position in any stocks mentioned.
About SHSE:600795
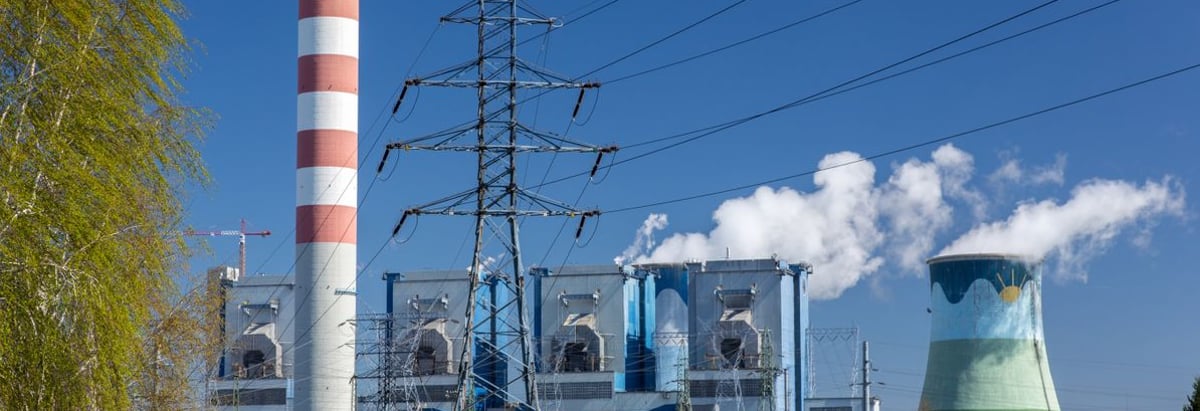
GD Power DevelopmentLtd
Operates as a power generation company in China.
