
Advertisement
- China
- /
- Electronic Equipment and Components
- /
- SZSE:301366
Shenzhen Edadoc Technology Co.,Ltd.'s (SZSE:301366) Stock Is Rallying But Financials Look Ambiguous: Will The Momentum Continue?
Shenzhen Edadoc TechnologyLtd (SZSE:301366) has had a great run on the share market with its stock up by a significant 14% over the last month. But the company's key financial indicators appear to be differing across the board and that makes us question whether or not the company's current share price momentum can be maintained. Specifically, we decided to study Shenzhen Edadoc TechnologyLtd's ROE in this article.
ROE or return on equity is a useful tool to assess how effectively a company can generate returns on the investment it received from its shareholders. In other words, it is a profitability ratio which measures the rate of return on the capital provided by the company's shareholders.
View our latest analysis for Shenzhen Edadoc TechnologyLtd
How Do You Calculate Return On Equity?
ROE can be calculated by using the formula:
Return on Equity = Net Profit (from continuing operations) ÷ Shareholders' Equity
So, based on the above formula, the ROE for Shenzhen Edadoc TechnologyLtd is:
4.7% = CN¥105m ÷ CN¥2.2b (Based on the trailing twelve months to September 2024).
The 'return' refers to a company's earnings over the last year. One way to conceptualize this is that for each CN¥1 of shareholders' capital it has, the company made CN¥0.05 in profit.
What Has ROE Got To Do With Earnings Growth?
Thus far, we have learned that ROE measures how efficiently a company is generating its profits. Based on how much of its profits the company chooses to reinvest or "retain", we are then able to evaluate a company's future ability to generate profits. Assuming everything else remains unchanged, the higher the ROE and profit retention, the higher the growth rate of a company compared to companies that don't necessarily bear these characteristics.
Shenzhen Edadoc TechnologyLtd's Earnings Growth And 4.7% ROE
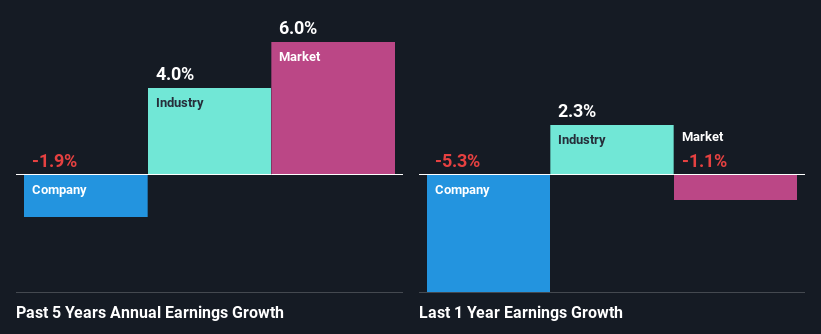
It is quite clear that Shenzhen Edadoc TechnologyLtd's ROE is rather low. Not just that, even compared to the industry average of 6.3%, the company's ROE is entirely unremarkable. As a result, Shenzhen Edadoc TechnologyLtd's flat earnings over the past five years doesn't come as a surprise given its lower ROE.
As a next step, we compared Shenzhen Edadoc TechnologyLtd's net income growth with the industry and discovered that the industry saw an average growth of 4.0% in the same period.
The basis for attaching value to a company is, to a great extent, tied to its earnings growth. What investors need to determine next is if the expected earnings growth, or the lack of it, is already built into the share price. By doing so, they will have an idea if the stock is headed into clear blue waters or if swampy waters await. One good indicator of expected earnings growth is the P/E ratio which determines the price the market is willing to pay for a stock based on its earnings prospects. So, you may want to check if Shenzhen Edadoc TechnologyLtd is trading on a high P/E or a low P/E, relative to its industry.
Is Shenzhen Edadoc TechnologyLtd Using Its Retained Earnings Effectively?
Despite having a normal three-year median payout ratio of 40% (implying that the company keeps 60% of its income) over the last three years, Shenzhen Edadoc TechnologyLtd has seen a negligible amount of growth in earnings as we saw above. Therefore, there might be some other reasons to explain the lack in that respect. For example, the business could be in decline.
Only recently, Shenzhen Edadoc TechnologyLtd started paying a dividend. This means that the management might have concluded that its shareholders prefer dividends over earnings growth.
Summary
Overall, we have mixed feelings about Shenzhen Edadoc TechnologyLtd. While the company does have a high rate of profit retention, its low rate of return is probably hampering its earnings growth. So far, we've only made a quick discussion around the company's earnings growth. You can do your own research on Shenzhen Edadoc TechnologyLtd and see how it has performed in the past by looking at this FREE detailed graph of past earnings, revenue and cash flows.
New: Manage All Your Stock Portfolios in One Place
We've created the ultimate portfolio companion for stock investors, and it's free.
• Connect an unlimited number of Portfolios and see your total in one currency
• Be alerted to new Warning Signs or Risks via email or mobile
• Track the Fair Value of your stocks
Have feedback on this article? Concerned about the content? Get in touch with us directly. Alternatively, email editorial-team (at) simplywallst.com.
This article by Simply Wall St is general in nature. We provide commentary based on historical data and analyst forecasts only using an unbiased methodology and our articles are not intended to be financial advice. It does not constitute a recommendation to buy or sell any stock, and does not take account of your objectives, or your financial situation. We aim to bring you long-term focused analysis driven by fundamental data. Note that our analysis may not factor in the latest price-sensitive company announcements or qualitative material. Simply Wall St has no position in any stocks mentioned.
About SZSE:301366
Shenzhen Edadoc TechnologyLtd
Provides printed circuit board (PCB) design and PCB assembly manufacturing services in China and internationally.
Excellent balance sheet with slight risk.
Market Insights

Advertisement
Community Narratives
The "Molecular Pencil": Why Beam's Technology is Built to Win
Fair Value US$65.01|66.7% undervalued
DA
Community Contributor
The silent giant behind virtually every advanced chip powering AI, smartphones, and modern infrastructure.
Fair Value US$310.00|4.8% undervalued
OS
Community Contributor
ADP Stock: Solid Fundamentals, But AI Investments Test Its Margin Resilience
Fair Value US$387.77|34.5% undervalued
YI
Community Contributor
MINISO's fair value is projected at 26.69 with an anticipated PE ratio shift of 20x
Fair Value US$24.03|9.6% undervalued
BE
Community Contributor