Stock Analysis
- China
- /
- Communications
- /
- SZSE:301318
Is ValueHD Corporation's (SZSE:301318) Recent Price Movement Underpinned By Its Weak Fundamentals?


It is hard to get excited after looking at ValueHD's (SZSE:301318) recent performance, when its stock has declined 24% over the past three months. It is possible that the markets have ignored the company's differing financials and decided to lean-in to the negative sentiment. Stock prices are usually driven by a company’s financial performance over the long term, and therefore we decided to pay more attention to the company's financial performance. Specifically, we decided to study ValueHD's ROE in this article.
Return on equity or ROE is an important factor to be considered by a shareholder because it tells them how effectively their capital is being reinvested. In short, ROE shows the profit each dollar generates with respect to its shareholder investments.
Check out our latest analysis for ValueHD
How Is ROE Calculated?
The formula for ROE is:
Return on Equity = Net Profit (from continuing operations) ÷ Shareholders' Equity
So, based on the above formula, the ROE for ValueHD is:
4.8% = CN¥84m ÷ CN¥1.8b (Based on the trailing twelve months to March 2024).
The 'return' is the profit over the last twelve months. That means that for every CN¥1 worth of shareholders' equity, the company generated CN¥0.05 in profit.
What Has ROE Got To Do With Earnings Growth?
Thus far, we have learned that ROE measures how efficiently a company is generating its profits. Depending on how much of these profits the company reinvests or "retains", and how effectively it does so, we are then able to assess a company’s earnings growth potential. Assuming all else is equal, companies that have both a higher return on equity and higher profit retention are usually the ones that have a higher growth rate when compared to companies that don't have the same features.
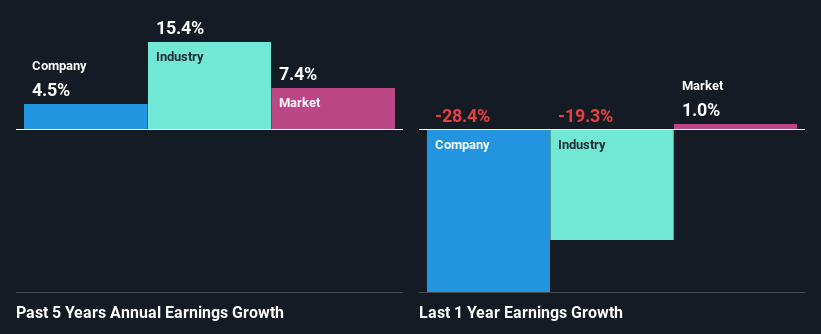
A Side By Side comparison of ValueHD's Earnings Growth And 4.8% ROE
As you can see, ValueHD's ROE looks pretty weak. Even when compared to the industry average of 6.2%, the ROE figure is pretty disappointing. Therefore, the disappointing ROE therefore provides a background to ValueHD's very little net income growth of 4.5% over the past five years.
We then compared ValueHD's net income growth with the industry and found that the company's growth figure is lower than the average industry growth rate of 15% in the same 5-year period, which is a bit concerning.
The basis for attaching value to a company is, to a great extent, tied to its earnings growth. It’s important for an investor to know whether the market has priced in the company's expected earnings growth (or decline). Doing so will help them establish if the stock's future looks promising or ominous. One good indicator of expected earnings growth is the P/E ratio which determines the price the market is willing to pay for a stock based on its earnings prospects. So, you may want to check if ValueHD is trading on a high P/E or a low P/E, relative to its industry.
Is ValueHD Making Efficient Use Of Its Profits?
ValueHD has a low three-year median payout ratio of 23% (meaning, the company keeps the remaining 77% of profits) which means that the company is retaining more of its earnings. This should be reflected in its earnings growth number, but that's not the case. So there might be other factors at play here which could potentially be hampering growth. For example, the business has faced some headwinds.
Only recently, ValueHD started paying a dividend. This means that the management might have concluded that its shareholders prefer dividends over earnings growth.
Summary
On the whole, we feel that the performance shown by ValueHD can be open to many interpretations. Even though it appears to be retaining most of its profits, given the low ROE, investors may not be benefitting from all that reinvestment after all. The low earnings growth suggests our theory correct. Wrapping up, we would proceed with caution with this company and one way of doing that would be to look at the risk profile of the business. Our risks dashboard will have the 1 risk we have identified for ValueHD.
Valuation is complex, but we're helping make it simple.
Find out whether ValueHD is potentially over or undervalued by checking out our comprehensive analysis, which includes fair value estimates, risks and warnings, dividends, insider transactions and financial health.
View the Free AnalysisHave feedback on this article? Concerned about the content? Get in touch with us directly. Alternatively, email editorial-team (at) simplywallst.com.
This article by Simply Wall St is general in nature. We provide commentary based on historical data and analyst forecasts only using an unbiased methodology and our articles are not intended to be financial advice. It does not constitute a recommendation to buy or sell any stock, and does not take account of your objectives, or your financial situation. We aim to bring you long-term focused analysis driven by fundamental data. Note that our analysis may not factor in the latest price-sensitive company announcements or qualitative material. Simply Wall St has no position in any stocks mentioned.
Valuation is complex, but we're helping make it simple.
Find out whether ValueHD is potentially over or undervalued by checking out our comprehensive analysis, which includes fair value estimates, risks and warnings, dividends, insider transactions and financial health.
View the Free AnalysisHave feedback on this article? Concerned about the content? Get in touch with us directly. Alternatively, email editorial-team@simplywallst.com
About SZSE:301318
Flawless balance sheet and slightly overvalued.
