- China
- /
- Electronic Equipment and Components
- /
- SZSE:300902
Are Poor Financial Prospects Dragging Down Guoanda Co., Ltd. (SZSE:300902 Stock?


It is hard to get excited after looking at Guoanda's (SZSE:300902) recent performance, when its stock has declined 8.2% over the past week. Given that stock prices are usually driven by a company’s fundamentals over the long term, which in this case look pretty weak, we decided to study the company's key financial indicators. Specifically, we decided to study Guoanda's ROE in this article.
Return on equity or ROE is an important factor to be considered by a shareholder because it tells them how effectively their capital is being reinvested. Simply put, it is used to assess the profitability of a company in relation to its equity capital.
See our latest analysis for Guoanda
How Is ROE Calculated?
The formula for return on equity is:
Return on Equity = Net Profit (from continuing operations) ÷ Shareholders' Equity
So, based on the above formula, the ROE for Guoanda is:
4.8% = CN¥45m ÷ CN¥922m (Based on the trailing twelve months to March 2024).
The 'return' is the income the business earned over the last year. So, this means that for every CN¥1 of its shareholder's investments, the company generates a profit of CN¥0.05.
Why Is ROE Important For Earnings Growth?
We have already established that ROE serves as an efficient profit-generating gauge for a company's future earnings. Depending on how much of these profits the company reinvests or "retains", and how effectively it does so, we are then able to assess a company’s earnings growth potential. Generally speaking, other things being equal, firms with a high return on equity and profit retention, have a higher growth rate than firms that don’t share these attributes.
Guoanda's Earnings Growth And 4.8% ROE
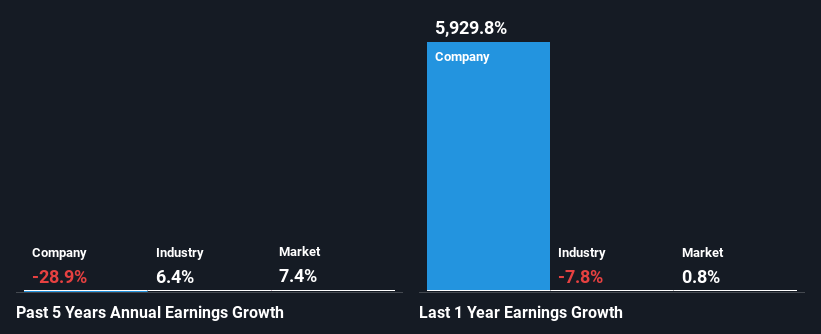
As you can see, Guoanda's ROE looks pretty weak. Even when compared to the industry average of 6.3%, the ROE figure is pretty disappointing. Given the circumstances, the significant decline in net income by 29% seen by Guoanda over the last five years is not surprising. We believe that there also might be other aspects that are negatively influencing the company's earnings prospects. For instance, the company has a very high payout ratio, or is faced with competitive pressures.
So, as a next step, we compared Guoanda's performance against the industry and were disappointed to discover that while the company has been shrinking its earnings, the industry has been growing its earnings at a rate of 6.4% over the last few years.
Earnings growth is a huge factor in stock valuation. It’s important for an investor to know whether the market has priced in the company's expected earnings growth (or decline). This then helps them determine if the stock is placed for a bright or bleak future. One good indicator of expected earnings growth is the P/E ratio which determines the price the market is willing to pay for a stock based on its earnings prospects. So, you may want to check if Guoanda is trading on a high P/E or a low P/E, relative to its industry.
Is Guoanda Using Its Retained Earnings Effectively?
Guoanda's declining earnings is not surprising given how the company is spending most of its profits in paying dividends, judging by its three-year median payout ratio of 90% (or a retention ratio of 10%). With only very little left to reinvest into the business, growth in earnings is far from likely. You can see the 2 risks we have identified for Guoanda by visiting our risks dashboard for free on our platform here.
Moreover, Guoanda has been paying dividends for three years, which is a considerable amount of time, suggesting that management must have perceived that the shareholders prefer consistent dividends even though earnings have been shrinking.
Conclusion
On the whole, Guoanda's performance is quite a big let-down. As a result of its low ROE and lack of much reinvestment into the business, the company has seen a disappointing earnings growth rate. Until now, we have only just grazed the surface of the company's past performance by looking at the company's fundamentals. You can do your own research on Guoanda and see how it has performed in the past by looking at this FREE detailed graph of past earnings, revenue and cash flows.
New: Manage All Your Stock Portfolios in One Place
We've created the ultimate portfolio companion for stock investors, and it's free.
• Connect an unlimited number of Portfolios and see your total in one currency
• Be alerted to new Warning Signs or Risks via email or mobile
• Track the Fair Value of your stocks
Have feedback on this article? Concerned about the content? Get in touch with us directly. Alternatively, email editorial-team (at) simplywallst.com.
This article by Simply Wall St is general in nature. We provide commentary based on historical data and analyst forecasts only using an unbiased methodology and our articles are not intended to be financial advice. It does not constitute a recommendation to buy or sell any stock, and does not take account of your objectives, or your financial situation. We aim to bring you long-term focused analysis driven by fundamental data. Note that our analysis may not factor in the latest price-sensitive company announcements or qualitative material. Simply Wall St has no position in any stocks mentioned.
About SZSE:300902
Guoanda
Engages in the research, development, production, and sale of automatic fire extinguishing devices and systems in China.
Flawless balance sheet with proven track record.
