- China
- /
- Communications
- /
- SZSE:300628
Yealink Network Technology's (SZSE:300628) five-year total shareholder returns outpace the underlying earnings growth


Generally speaking the aim of active stock picking is to find companies that provide returns that are superior to the market average. And while active stock picking involves risks (and requires diversification) it can also provide excess returns. To wit, the Yealink Network Technology share price has climbed 82% in five years, easily topping the market return of 15% (ignoring dividends). On the other hand, the more recent gains haven't been so impressive, with shareholders gaining just 0.8%, including dividends.
Although Yealink Network Technology has shed CN¥2.4b from its market cap this week, let's take a look at its longer term fundamental trends and see if they've driven returns.
See our latest analysis for Yealink Network Technology
There is no denying that markets are sometimes efficient, but prices do not always reflect underlying business performance. One imperfect but simple way to consider how the market perception of a company has shifted is to compare the change in the earnings per share (EPS) with the share price movement.
Over half a decade, Yealink Network Technology managed to grow its earnings per share at 18% a year. The EPS growth is more impressive than the yearly share price gain of 13% over the same period. Therefore, it seems the market has become relatively pessimistic about the company.
You can see below how EPS has changed over time (discover the exact values by clicking on the image).
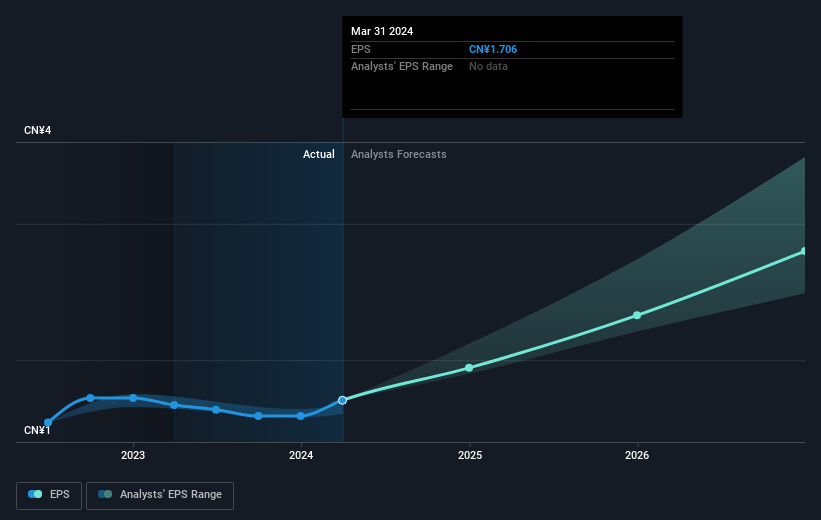
This free interactive report on Yealink Network Technology's earnings, revenue and cash flow is a great place to start, if you want to investigate the stock further.
What About Dividends?
When looking at investment returns, it is important to consider the difference between total shareholder return (TSR) and share price return. Whereas the share price return only reflects the change in the share price, the TSR includes the value of dividends (assuming they were reinvested) and the benefit of any discounted capital raising or spin-off. Arguably, the TSR gives a more comprehensive picture of the return generated by a stock. As it happens, Yealink Network Technology's TSR for the last 5 years was 97%, which exceeds the share price return mentioned earlier. This is largely a result of its dividend payments!
A Different Perspective
It's good to see that Yealink Network Technology has rewarded shareholders with a total shareholder return of 0.8% in the last twelve months. Of course, that includes the dividend. However, the TSR over five years, coming in at 15% per year, is even more impressive. The pessimistic view would be that be that the stock has its best days behind it, but on the other hand the price might simply be moderating while the business itself continues to execute. While it is well worth considering the different impacts that market conditions can have on the share price, there are other factors that are even more important. Even so, be aware that Yealink Network Technology is showing 1 warning sign in our investment analysis , you should know about...
Of course, you might find a fantastic investment by looking elsewhere. So take a peek at this free list of companies we expect will grow earnings.
Please note, the market returns quoted in this article reflect the market weighted average returns of stocks that currently trade on Chinese exchanges.
New: Manage All Your Stock Portfolios in One Place
We've created the ultimate portfolio companion for stock investors, and it's free.
• Connect an unlimited number of Portfolios and see your total in one currency
• Be alerted to new Warning Signs or Risks via email or mobile
• Track the Fair Value of your stocks
Have feedback on this article? Concerned about the content? Get in touch with us directly. Alternatively, email editorial-team (at) simplywallst.com.
This article by Simply Wall St is general in nature. We provide commentary based on historical data and analyst forecasts only using an unbiased methodology and our articles are not intended to be financial advice. It does not constitute a recommendation to buy or sell any stock, and does not take account of your objectives, or your financial situation. We aim to bring you long-term focused analysis driven by fundamental data. Note that our analysis may not factor in the latest price-sensitive company announcements or qualitative material. Simply Wall St has no position in any stocks mentioned.
About SZSE:300628
Yealink Network Technology
Provides voice conferencing, voice communications, and collaboration solutions worldwide.
Very undervalued with flawless balance sheet.
