- China
- /
- Electronic Equipment and Components
- /
- SZSE:000062
Shenzhen Huaqiang Industry Co., Ltd.'s (SZSE:000062) Financials Are Too Obscure To Link With Current Share Price Momentum: What's In Store For the Stock?


Shenzhen Huaqiang Industry (SZSE:000062) has had a great run on the share market with its stock up by a significant 5.0% over the last week. But the company's key financial indicators appear to be differing across the board and that makes us question whether or not the company's current share price momentum can be maintained. In this article, we decided to focus on Shenzhen Huaqiang Industry's ROE.
Return on equity or ROE is a key measure used to assess how efficiently a company's management is utilizing the company's capital. In short, ROE shows the profit each dollar generates with respect to its shareholder investments.
View our latest analysis for Shenzhen Huaqiang Industry
How Do You Calculate Return On Equity?
The formula for ROE is:
Return on Equity = Net Profit (from continuing operations) ÷ Shareholders' Equity
So, based on the above formula, the ROE for Shenzhen Huaqiang Industry is:
5.8% = CN¥473m ÷ CN¥8.1b (Based on the trailing twelve months to March 2024).
The 'return' is the income the business earned over the last year. That means that for every CN¥1 worth of shareholders' equity, the company generated CN¥0.06 in profit.
What Has ROE Got To Do With Earnings Growth?
So far, we've learned that ROE is a measure of a company's profitability. Based on how much of its profits the company chooses to reinvest or "retain", we are then able to evaluate a company's future ability to generate profits. Assuming all else is equal, companies that have both a higher return on equity and higher profit retention are usually the ones that have a higher growth rate when compared to companies that don't have the same features.
Shenzhen Huaqiang Industry's Earnings Growth And 5.8% ROE
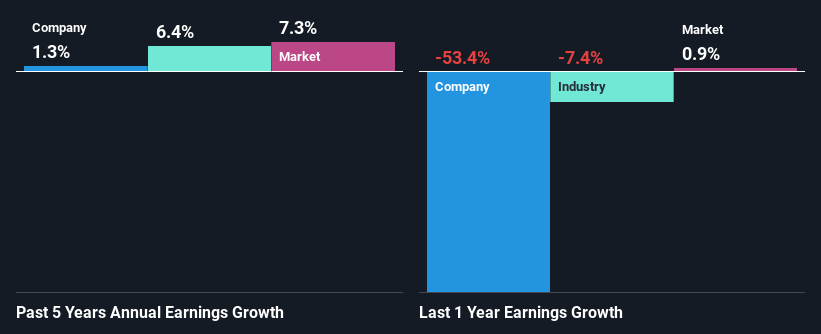
At first glance, Shenzhen Huaqiang Industry's ROE doesn't look very promising. Yet, a closer study shows that the company's ROE is similar to the industry average of 6.3%. Still, Shenzhen Huaqiang Industry has seen a flat net income growth over the past five years. Bear in mind, the company's ROE is not very high. So that could also be one of the reasons behind the company's flat growth in earnings.
Next, on comparing with the industry net income growth, we found that Shenzhen Huaqiang Industry's reported growth was lower than the industry growth of 6.4% over the last few years, which is not something we like to see.
Earnings growth is a huge factor in stock valuation. It’s important for an investor to know whether the market has priced in the company's expected earnings growth (or decline). Doing so will help them establish if the stock's future looks promising or ominous. One good indicator of expected earnings growth is the P/E ratio which determines the price the market is willing to pay for a stock based on its earnings prospects. So, you may want to check if Shenzhen Huaqiang Industry is trading on a high P/E or a low P/E, relative to its industry.
Is Shenzhen Huaqiang Industry Efficiently Re-investing Its Profits?
In spite of a normal three-year median payout ratio of 36% (or a retention ratio of 64%), Shenzhen Huaqiang Industry hasn't seen much growth in its earnings. Therefore, there might be some other reasons to explain the lack in that respect. For example, the business could be in decline.
Additionally, Shenzhen Huaqiang Industry has paid dividends over a period of at least ten years, which means that the company's management is determined to pay dividends even if it means little to no earnings growth.
Conclusion
Overall, we have mixed feelings about Shenzhen Huaqiang Industry. While the company does have a high rate of profit retention, its low rate of return is probably hampering its earnings growth. So far, we've only made a quick discussion around the company's earnings growth. So it may be worth checking this free detailed graph of Shenzhen Huaqiang Industry's past earnings, as well as revenue and cash flows to get a deeper insight into the company's performance.
New: Manage All Your Stock Portfolios in One Place
We've created the ultimate portfolio companion for stock investors, and it's free.
• Connect an unlimited number of Portfolios and see your total in one currency
• Be alerted to new Warning Signs or Risks via email or mobile
• Track the Fair Value of your stocks
Have feedback on this article? Concerned about the content? Get in touch with us directly. Alternatively, email editorial-team (at) simplywallst.com.
This article by Simply Wall St is general in nature. We provide commentary based on historical data and analyst forecasts only using an unbiased methodology and our articles are not intended to be financial advice. It does not constitute a recommendation to buy or sell any stock, and does not take account of your objectives, or your financial situation. We aim to bring you long-term focused analysis driven by fundamental data. Note that our analysis may not factor in the latest price-sensitive company announcements or qualitative material. Simply Wall St has no position in any stocks mentioned.
Have feedback on this article? Concerned about the content? Get in touch with us directly. Alternatively, email editorial-team@simplywallst.com
About SZSE:000062
Shenzhen Huaqiang Industry
Operates as an electronic components distributor in China.
Average dividend payer with mediocre balance sheet.
