Advertisement
- China
- /
- Electrical
- /
- SHSE:600261
Global Penny Stocks Under US$700M Market Cap: 3 Picks To Watch

Simply Wall St
Reviewed by Simply Wall St
Amid a backdrop of fluctuating global markets, where U.S. equity indexes have shown mixed results and economic indicators suggest a weakening labor market, investors are keenly observing the potential impacts on interest rates and growth prospects. In such a climate, penny stocks—often representing smaller or newer companies—offer intriguing opportunities for those seeking value at lower price points. While the term "penny stock" may seem antiquated, these investments can still provide significant upside when backed by strong financials and sound fundamentals.
Top 10 Penny Stocks Globally
| Name | Share Price | Market Cap | Rewards & Risks |
| Lever Style (SEHK:1346) | HK$1.60 | HK$1.02B | ✅ 4 ⚠️ 1 View Analysis > |
| IVE Group (ASX:IGL) | A$2.71 | A$422.13M | ✅ 4 ⚠️ 3 View Analysis > |
| HSS Engineers Berhad (KLSE:HSSEB) | MYR0.58 | MYR294.92M | ✅ 4 ⚠️ 3 View Analysis > |
| TK Group (Holdings) (SEHK:2283) | HK$2.54 | HK$2.08B | ✅ 4 ⚠️ 1 View Analysis > |
| Angler Gaming (NGM:ANGL) | SEK3.60 | SEK269.95M | ✅ 4 ⚠️ 2 View Analysis > |
| Deleum Berhad (KLSE:DELEUM) | MYR1.38 | MYR554.14M | ✅ 5 ⚠️ 1 View Analysis > |
| Yangzijiang Shipbuilding (Holdings) (SGX:BS6) | SGD3.19 | SGD12.55B | ✅ 5 ⚠️ 1 View Analysis > |
| Begbies Traynor Group (AIM:BEG) | £1.19 | £189.45M | ✅ 4 ⚠️ 3 View Analysis > |
| Deceuninck (ENXTBR:DECB) | €2.085 | €288.19M | ✅ 4 ⚠️ 1 View Analysis > |
| Netgem (ENXTPA:ALNTG) | €0.926 | €31.23M | ✅ 4 ⚠️ 2 View Analysis > |
Click here to see the full list of 3,732 stocks from our Global Penny Stocks screener.
Let's take a closer look at a couple of our picks from the screened companies.
Zhejiang Yankon Group (SHSE:600261)
Simply Wall St Financial Health Rating: ★★★★★★
Overview: Zhejiang Yankon Group Co., Ltd. focuses on the research, development, production, and sales of lighting appliances in China with a market cap of CN¥4.70 billion.
Operations: No specific revenue segments are reported for Zhejiang Yankon Group Co., Ltd.
Market Cap: CN¥4.7B
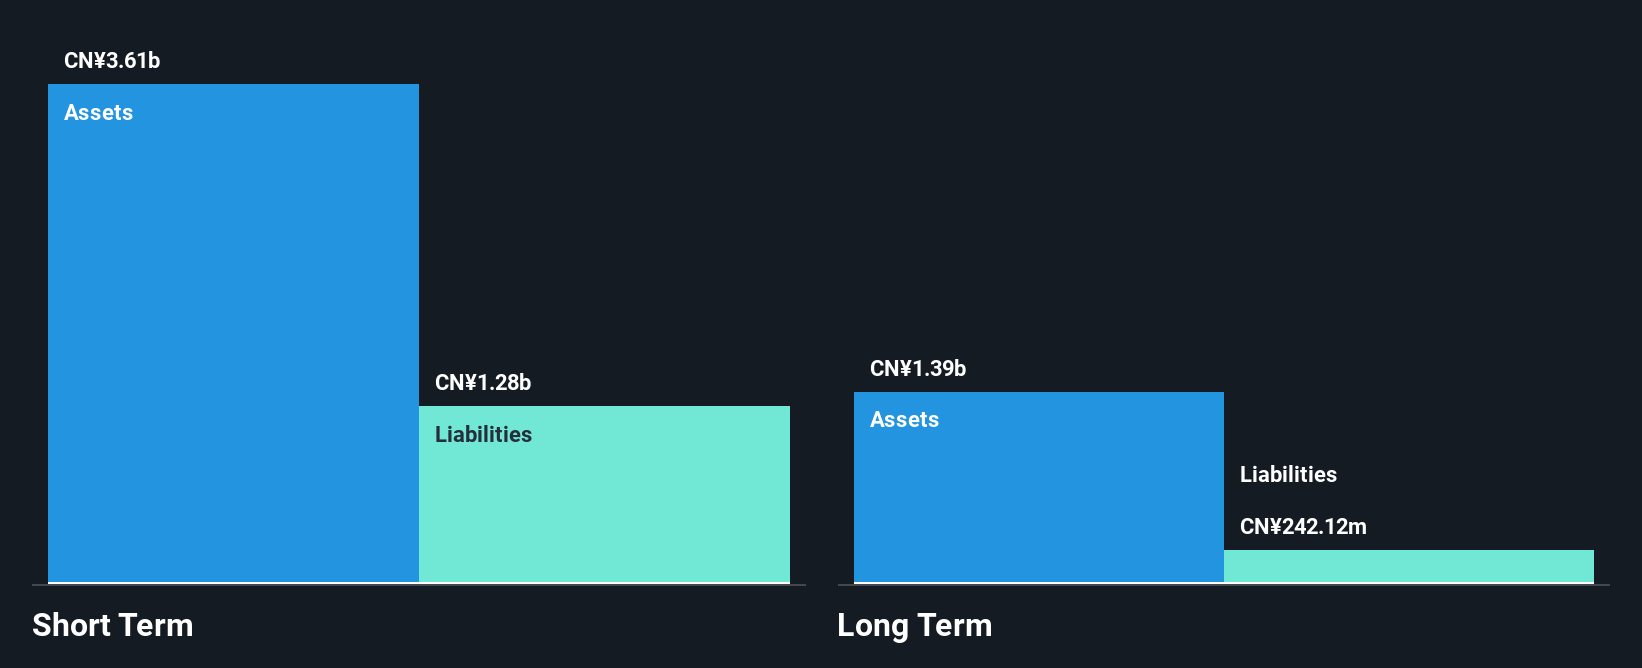
Zhejiang Yankon Group Co., Ltd. has shown a significant improvement in earnings, growing by 53.6% over the past year, despite a five-year decline of 21.1% annually. The company's net income increased to CN¥96.54 million from CN¥73.11 million compared to the previous year, aided by a large one-off gain of CN¥128.2 million impacting recent financial results. While its short-term assets of CN¥3.6 billion exceed both short and long-term liabilities, indicating strong liquidity, the dividend yield of 3.91% is not well covered by free cash flows, highlighting potential concerns for investors seeking sustainable income streams from this stock.
- Unlock comprehensive insights into our analysis of Zhejiang Yankon Group stock in this financial health report.
- Examine Zhejiang Yankon Group's past performance report to understand how it has performed in prior years.
CASIN Real Estate Development GroupLtd (SZSE:000838)
Simply Wall St Financial Health Rating: ★★★★★★
Overview: CASIN Real Estate Development Group Co., Ltd. operates in the real estate development sector with a market capitalization of CN¥3.07 billion.
Operations: CASIN Real Estate Development Group Co., Ltd. has not reported any specific revenue segments.
Market Cap: CN¥3.07B
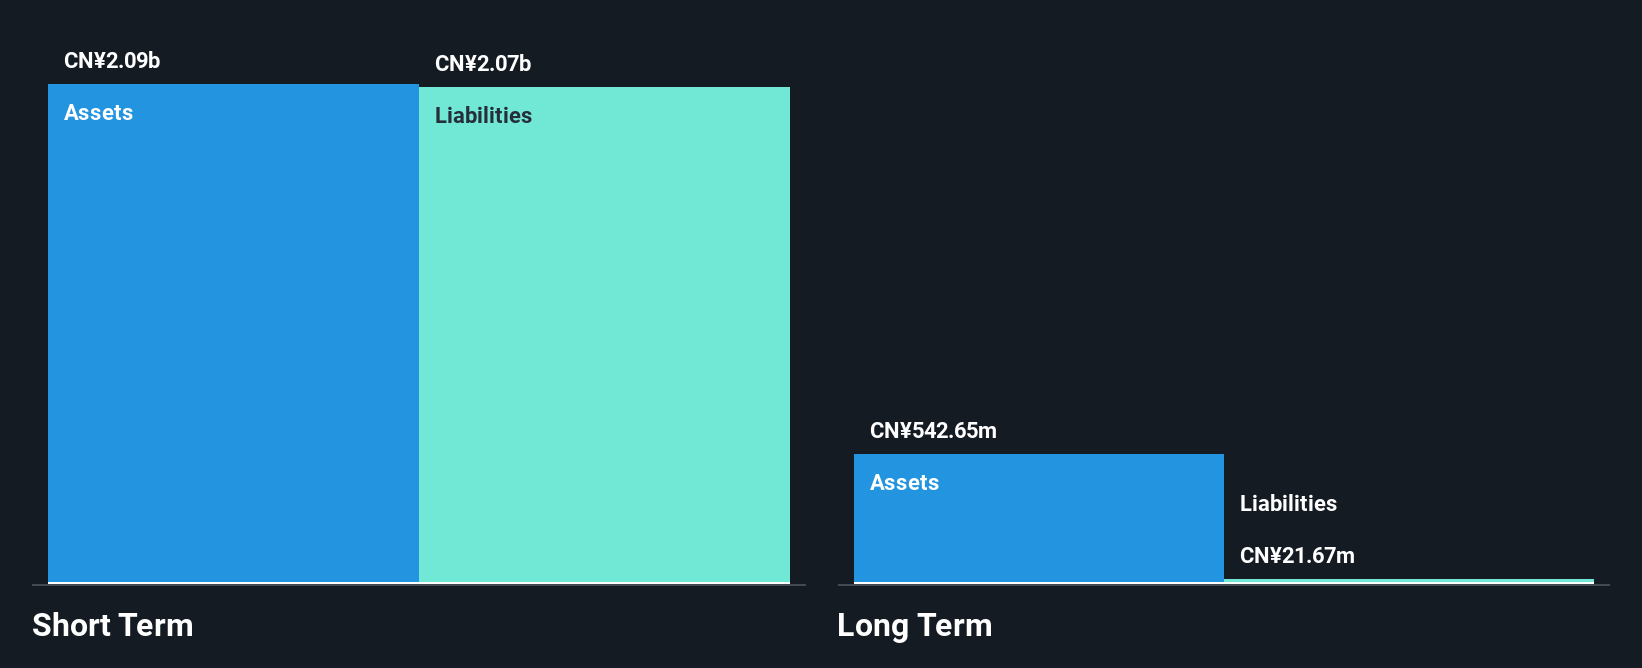
CASIN Real Estate Development Group Ltd. recently reported a significant decline in revenue to CN¥179.6 million for the first half of 2025, down from CN¥645.26 million the previous year, resulting in a net loss of CN¥4.45 million. Despite these challenges, the company maintains financial stability with short-term assets covering both short and long-term liabilities and having more cash than total debt. The management team is experienced with an average tenure of 4.5 years, and while unprofitable, CASIN has a cash runway exceeding three years if current free cash flow levels are sustained without further shrinkage.
- Dive into the specifics of CASIN Real Estate Development GroupLtd here with our thorough balance sheet health report.
- Understand CASIN Real Estate Development GroupLtd's track record by examining our performance history report.
Sanxiang Impression (SZSE:000863)
Simply Wall St Financial Health Rating: ★★★★★★
Overview: Sanxiang Impression Co., Ltd. is involved in the development of real estate properties in China and has a market cap of CN¥4.24 billion.
Operations: Sanxiang Impression Co., Ltd. has not reported any specific revenue segments.
Market Cap: CN¥4.24B
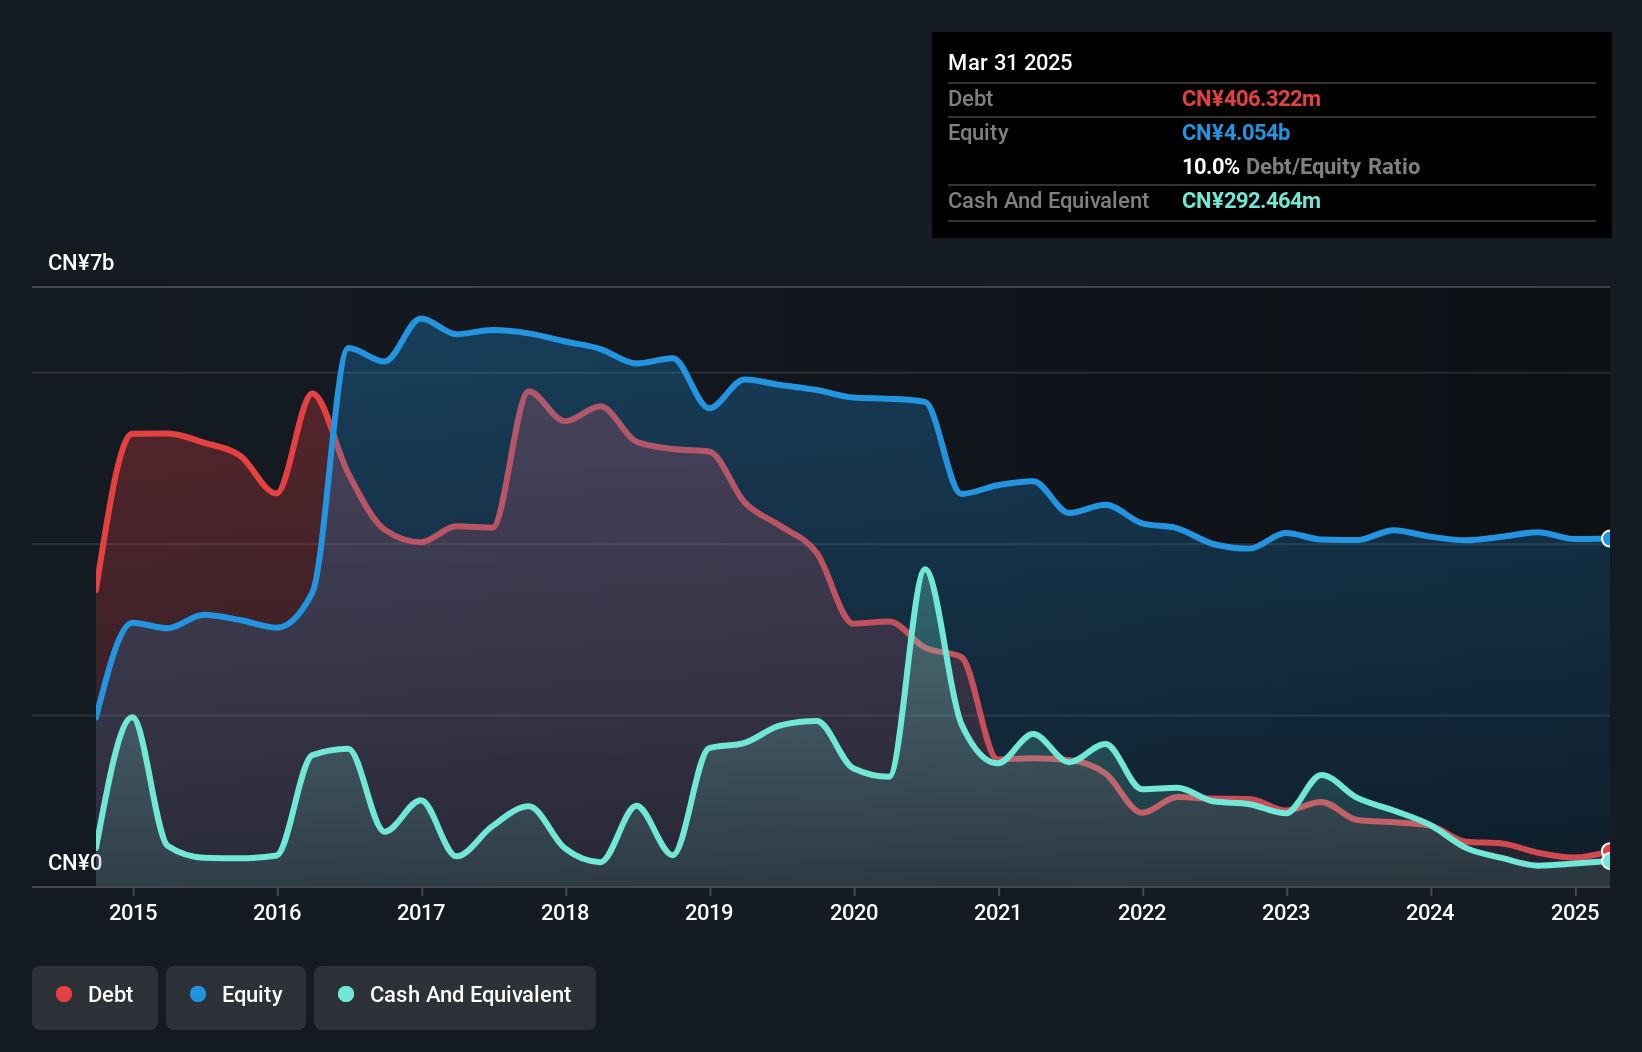
Sanxiang Impression Co., Ltd. reported a decrease in revenue to CN¥376.68 million for the first half of 2025, down from CN¥601.46 million the previous year, with net income dropping to CN¥5.92 million from CN¥11.91 million. Despite these declines, the company's financial position remains stable as short-term assets significantly exceed both short and long-term liabilities, and its net debt to equity ratio is satisfactory at 3.4%. The board and management team are experienced with average tenures of 4.3 years and 5.3 years respectively, while interest payments are well covered by EBIT at an 8.3x coverage rate.
- Navigate through the intricacies of Sanxiang Impression with our comprehensive balance sheet health report here.
- Review our historical performance report to gain insights into Sanxiang Impression's track record.
Make It Happen
- Reveal the 3,732 hidden gems among our Global Penny Stocks screener with a single click here.
- Interested In Other Possibilities? Find companies with promising cash flow potential yet trading below their fair value.
This article by Simply Wall St is general in nature. We provide commentary based on historical data and analyst forecasts only using an unbiased methodology and our articles are not intended to be financial advice. It does not constitute a recommendation to buy or sell any stock, and does not take account of your objectives, or your financial situation. We aim to bring you long-term focused analysis driven by fundamental data. Note that our analysis may not factor in the latest price-sensitive company announcements or qualitative material. Simply Wall St has no position in any stocks mentioned.
Valuation is complex, but we're here to simplify it.
Discover if Zhejiang Yankon Group might be undervalued or overvalued with our detailed analysis, featuring fair value estimates, potential risks, dividends, insider trades, and its financial condition.
Access Free AnalysisHave feedback on this article? Concerned about the content? Get in touch with us directly. Alternatively, email editorial-team@simplywallst.com
About SHSE:600261
Zhejiang Yankon Group
Engages in the research and development, production, and sales of lighting appliances in China.
Flawless balance sheet second-rate dividend payer.
Market Insights

Advertisement
Community Narratives
The company that turned a verb into a global necessity and basically runs the modern internet, digital ads, smartphones, maps, and AI.
Fair Value US$300.00|5.1% undervalued
OS
Community Contributor
Flowers Foods Pays A Fair Price For Health
Fair Value US$16.12|27.7% undervalued
NV
Community Contributor
TMX Group will thrive with 33.3% profit margin and enduring market moat
Fair Value CA$49.90|0.2% overvalued
LI
Community Contributor
The "Molecular Pencil": Why Beam's Technology is Built to Win
Fair Value US$65.01|64.4% undervalued
DA
Community Contributor