
Advertisement
- China
- /
- Real Estate
- /
- SZSE:000042
The Market Doesn't Like What It Sees From Shenzhen Centralcon Investment Holding Co., Ltd.'s (SZSE:000042) Revenues Yet As Shares Tumble 28%
Unfortunately for some shareholders, the Shenzhen Centralcon Investment Holding Co., Ltd. (SZSE:000042) share price has dived 28% in the last thirty days, prolonging recent pain. The recent drop completes a disastrous twelve months for shareholders, who are sitting on a 58% loss during that time.
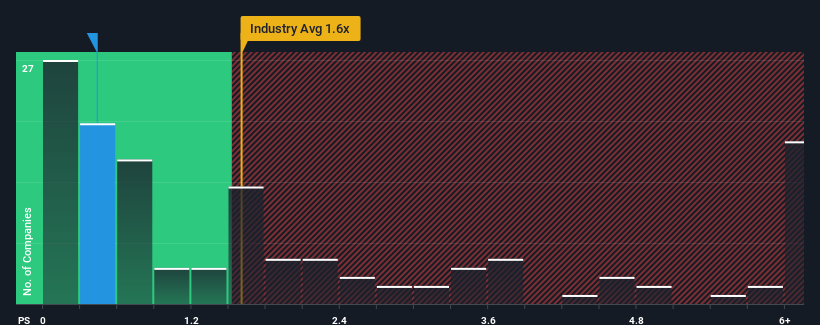
After such a large drop in price, Shenzhen Centralcon Investment Holding may be sending buy signals at present with its price-to-sales (or "P/S") ratio of 0.4x, considering almost half of all companies in the Real Estate industry in China have P/S ratios greater than 1.6x and even P/S higher than 4x aren't out of the ordinary. Although, it's not wise to just take the P/S at face value as there may be an explanation why it's limited.
See our latest analysis for Shenzhen Centralcon Investment Holding
What Does Shenzhen Centralcon Investment Holding's P/S Mean For Shareholders?
For example, consider that Shenzhen Centralcon Investment Holding's financial performance has been poor lately as its revenue has been in decline. Perhaps the market believes the recent revenue performance isn't good enough to keep up the industry, causing the P/S ratio to suffer. However, if this doesn't eventuate then existing shareholders may be feeling optimistic about the future direction of the share price.
Want the full picture on earnings, revenue and cash flow for the company? Then our free report on Shenzhen Centralcon Investment Holding will help you shine a light on its historical performance.Is There Any Revenue Growth Forecasted For Shenzhen Centralcon Investment Holding?
In order to justify its P/S ratio, Shenzhen Centralcon Investment Holding would need to produce sluggish growth that's trailing the industry.
Retrospectively, the last year delivered a frustrating 39% decrease to the company's top line. This means it has also seen a slide in revenue over the longer-term as revenue is down 41% in total over the last three years. So unfortunately, we have to acknowledge that the company has not done a great job of growing revenue over that time.
Weighing that medium-term revenue trajectory against the broader industry's one-year forecast for expansion of 5.0% shows it's an unpleasant look.
With this information, we are not surprised that Shenzhen Centralcon Investment Holding is trading at a P/S lower than the industry. Nonetheless, there's no guarantee the P/S has reached a floor yet with revenue going in reverse. Even just maintaining these prices could be difficult to achieve as recent revenue trends are already weighing down the shares.
The Final Word
Shenzhen Centralcon Investment Holding's P/S has taken a dip along with its share price. It's argued the price-to-sales ratio is an inferior measure of value within certain industries, but it can be a powerful business sentiment indicator.
It's no surprise that Shenzhen Centralcon Investment Holding maintains its low P/S off the back of its sliding revenue over the medium-term. At this stage investors feel the potential for an improvement in revenue isn't great enough to justify a higher P/S ratio. Given the current circumstances, it seems unlikely that the share price will experience any significant movement in either direction in the near future if recent medium-term revenue trends persist.
Before you settle on your opinion, we've discovered 3 warning signs for Shenzhen Centralcon Investment Holding (2 are significant!) that you should be aware of.
It's important to make sure you look for a great company, not just the first idea you come across. So if growing profitability aligns with your idea of a great company, take a peek at this free list of interesting companies with strong recent earnings growth (and a low P/E).
New: Manage All Your Stock Portfolios in One Place
We've created the ultimate portfolio companion for stock investors, and it's free.
• Connect an unlimited number of Portfolios and see your total in one currency
• Be alerted to new Warning Signs or Risks via email or mobile
• Track the Fair Value of your stocks
Have feedback on this article? Concerned about the content? Get in touch with us directly. Alternatively, email editorial-team (at) simplywallst.com.
This article by Simply Wall St is general in nature. We provide commentary based on historical data and analyst forecasts only using an unbiased methodology and our articles are not intended to be financial advice. It does not constitute a recommendation to buy or sell any stock, and does not take account of your objectives, or your financial situation. We aim to bring you long-term focused analysis driven by fundamental data. Note that our analysis may not factor in the latest price-sensitive company announcements or qualitative material. Simply Wall St has no position in any stocks mentioned.
About SZSE:000042
Shenzhen Centralcon Investment Holding
Shenzhen Centralcon Investment Holding Co., Ltd.
Adequate balance sheet and fair value.
Market Insights

Advertisement
Community Narratives
The company that turned a verb into a global necessity and basically runs the modern internet, digital ads, smartphones, maps, and AI.
Fair Value US$300.00|7.1% undervalued
OS
Community Contributor
Flowers Foods Pays A Fair Price For Health
Fair Value US$16.12|26.4% undervalued
NV
Community Contributor
TMX Group will thrive with 33.3% profit margin and enduring market moat
Fair Value CA$49.90|0.8% overvalued
LI
Community Contributor
The "Molecular Pencil": Why Beam's Technology is Built to Win
Fair Value US$65.01|65.8% undervalued
DA
Community Contributor