Stock Analysis
- China
- /
- Real Estate
- /
- SHSE:603682
Shanghai Golden Union Commercial Management Co.,Ltd.'s (SHSE:603682) Stock Has Shown Weakness Lately But Financial Prospects Look Decent: Is The Market Wrong?


With its stock down 19% over the past three months, it is easy to disregard Shanghai Golden Union Commercial ManagementLtd (SHSE:603682). However, the company's fundamentals look pretty decent, and long-term financials are usually aligned with future market price movements. Specifically, we decided to study Shanghai Golden Union Commercial ManagementLtd's ROE in this article.
Return on equity or ROE is an important factor to be considered by a shareholder because it tells them how effectively their capital is being reinvested. In simpler terms, it measures the profitability of a company in relation to shareholder's equity.
Check out our latest analysis for Shanghai Golden Union Commercial ManagementLtd
How Do You Calculate Return On Equity?
The formula for return on equity is:
Return on Equity = Net Profit (from continuing operations) ÷ Shareholders' Equity
So, based on the above formula, the ROE for Shanghai Golden Union Commercial ManagementLtd is:
7.0% = CN¥83m ÷ CN¥1.2b (Based on the trailing twelve months to December 2023).
The 'return' is the profit over the last twelve months. Another way to think of that is that for every CN¥1 worth of equity, the company was able to earn CN¥0.07 in profit.
Why Is ROE Important For Earnings Growth?
Thus far, we have learned that ROE measures how efficiently a company is generating its profits. We now need to evaluate how much profit the company reinvests or "retains" for future growth which then gives us an idea about the growth potential of the company. Assuming everything else remains unchanged, the higher the ROE and profit retention, the higher the growth rate of a company compared to companies that don't necessarily bear these characteristics.
Shanghai Golden Union Commercial ManagementLtd's Earnings Growth And 7.0% ROE
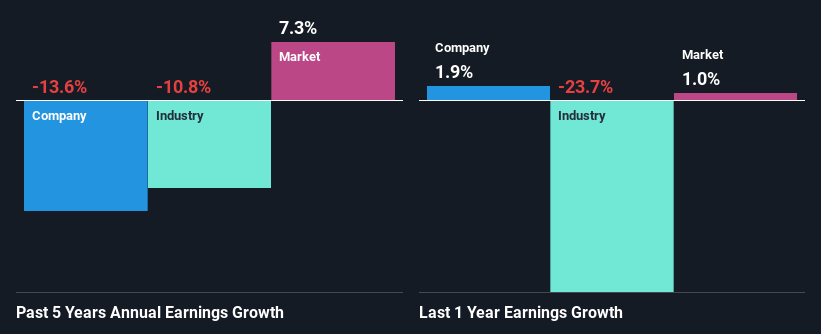
On the face of it, Shanghai Golden Union Commercial ManagementLtd's ROE is not much to talk about. However, the fact that the its ROE is quite higher to the industry average of 3.9% doesn't go unnoticed by us. However, Shanghai Golden Union Commercial ManagementLtd's five year net income decline rate was 14%. Remember, the company's ROE is a bit low to begin with, just that it is higher than the industry average. So that could be one of the factors that are causing earnings growth to shrink.
Next, when we compared with the industry, which has shrunk its earnings at a rate of 11% in the same 5-year period, we still found Shanghai Golden Union Commercial ManagementLtd's performance to be quite bleak, because the company has been shrinking its earnings faster than the industry.
Earnings growth is a huge factor in stock valuation. It’s important for an investor to know whether the market has priced in the company's expected earnings growth (or decline). Doing so will help them establish if the stock's future looks promising or ominous. If you're wondering about Shanghai Golden Union Commercial ManagementLtd's's valuation, check out this gauge of its price-to-earnings ratio, as compared to its industry.
Is Shanghai Golden Union Commercial ManagementLtd Efficiently Re-investing Its Profits?
While the company did payout a portion of its dividend in the past, it currently doesn't pay a regular dividend. This implies that potentially all of its profits are being reinvested in the business.
Summary
Overall, we feel that Shanghai Golden Union Commercial ManagementLtd certainly does have some positive factors to consider. Although, we are disappointed to see a lack of growth in earnings even in spite of a moderate ROE and and a high reinvestment rate. We believe that there might be some outside factors that could be having a negative impact on the business. So far, we've only made a quick discussion around the company's earnings growth. To gain further insights into Shanghai Golden Union Commercial ManagementLtd's past profit growth, check out this visualization of past earnings, revenue and cash flows.
New: Manage All Your Stock Portfolios in One Place
We've created the ultimate portfolio companion for stock investors, and it's free.
• Connect an unlimited number of Portfolios and see your total in one currency
• Be alerted to new Warning Signs or Risks via email or mobile
• Track the Fair Value of your stocks
Have feedback on this article? Concerned about the content? Get in touch with us directly. Alternatively, email editorial-team (at) simplywallst.com.
This article by Simply Wall St is general in nature. We provide commentary based on historical data and analyst forecasts only using an unbiased methodology and our articles are not intended to be financial advice. It does not constitute a recommendation to buy or sell any stock, and does not take account of your objectives, or your financial situation. We aim to bring you long-term focused analysis driven by fundamental data. Note that our analysis may not factor in the latest price-sensitive company announcements or qualitative material. Simply Wall St has no position in any stocks mentioned.
New: Manage All Your Stock Portfolios in One Place
We've created the ultimate portfolio companion for stock investors, and it's free.
• Connect an unlimited number of Portfolios and see your total in one currency
• Be alerted to new Warning Signs or Risks via email or mobile
• Track the Fair Value of your stocks
Have feedback on this article? Concerned about the content? Get in touch with us directly. Alternatively, email editorial-team@simplywallst.com
About SHSE:603682
Shanghai Golden Union Commercial ManagementLtd
Owns, operates, and manages commercial properties in China.
Good value with adequate balance sheet.
