Sunflower Pharmaceutical Group Co.,Ltd's (SZSE:002737) Fundamentals Look Pretty Strong: Could The Market Be Wrong About The Stock?


With its stock down 21% over the past three months, it is easy to disregard Sunflower Pharmaceutical GroupLtd (SZSE:002737). But if you pay close attention, you might gather that its strong financials could mean that the stock could potentially see an increase in value in the long-term, given how markets usually reward companies with good financial health. Specifically, we decided to study Sunflower Pharmaceutical GroupLtd's ROE in this article.
Return on Equity or ROE is a test of how effectively a company is growing its value and managing investors’ money. In short, ROE shows the profit each dollar generates with respect to its shareholder investments.
See our latest analysis for Sunflower Pharmaceutical GroupLtd
How Is ROE Calculated?
ROE can be calculated by using the formula:
Return on Equity = Net Profit (from continuing operations) ÷ Shareholders' Equity
So, based on the above formula, the ROE for Sunflower Pharmaceutical GroupLtd is:
19% = CN¥1b ÷ CN¥5.3b (Based on the trailing twelve months to March 2024).
The 'return' is the profit over the last twelve months. Another way to think of that is that for every CN¥1 worth of equity, the company was able to earn CN¥0.19 in profit.
Why Is ROE Important For Earnings Growth?
Thus far, we have learned that ROE measures how efficiently a company is generating its profits. We now need to evaluate how much profit the company reinvests or "retains" for future growth which then gives us an idea about the growth potential of the company. Generally speaking, other things being equal, firms with a high return on equity and profit retention, have a higher growth rate than firms that don’t share these attributes.
Sunflower Pharmaceutical GroupLtd's Earnings Growth And 19% ROE
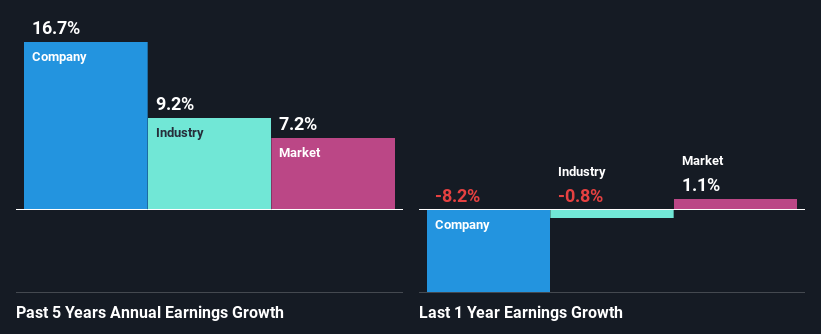
To start with, Sunflower Pharmaceutical GroupLtd's ROE looks acceptable. On comparing with the average industry ROE of 7.6% the company's ROE looks pretty remarkable. This probably laid the ground for Sunflower Pharmaceutical GroupLtd's moderate 17% net income growth seen over the past five years.
Next, on comparing with the industry net income growth, we found that Sunflower Pharmaceutical GroupLtd's growth is quite high when compared to the industry average growth of 9.2% in the same period, which is great to see.
The basis for attaching value to a company is, to a great extent, tied to its earnings growth. The investor should try to establish if the expected growth or decline in earnings, whichever the case may be, is priced in. Doing so will help them establish if the stock's future looks promising or ominous. If you're wondering about Sunflower Pharmaceutical GroupLtd's's valuation, check out this gauge of its price-to-earnings ratio, as compared to its industry.
Is Sunflower Pharmaceutical GroupLtd Using Its Retained Earnings Effectively?
The high three-year median payout ratio of 53% (or a retention ratio of 47%) for Sunflower Pharmaceutical GroupLtd suggests that the company's growth wasn't really hampered despite it returning most of its income to its shareholders.
Additionally, Sunflower Pharmaceutical GroupLtd has paid dividends over a period of nine years which means that the company is pretty serious about sharing its profits with shareholders.
Conclusion
Overall, we are quite pleased with Sunflower Pharmaceutical GroupLtd's performance. In particular, its high ROE is quite noteworthy and also the probable explanation behind its considerable earnings growth. Yet, the company is retaining a small portion of its profits. Which means that the company has been able to grow its earnings in spite of it, so that's not too bad. Until now, we have only just grazed the surface of the company's past performance by looking at the company's fundamentals. So it may be worth checking this free detailed graph of Sunflower Pharmaceutical GroupLtd's past earnings, as well as revenue and cash flows to get a deeper insight into the company's performance.
New: Manage All Your Stock Portfolios in One Place
We've created the ultimate portfolio companion for stock investors, and it's free.
• Connect an unlimited number of Portfolios and see your total in one currency
• Be alerted to new Warning Signs or Risks via email or mobile
• Track the Fair Value of your stocks
Have feedback on this article? Concerned about the content? Get in touch with us directly. Alternatively, email editorial-team (at) simplywallst.com.
This article by Simply Wall St is general in nature. We provide commentary based on historical data and analyst forecasts only using an unbiased methodology and our articles are not intended to be financial advice. It does not constitute a recommendation to buy or sell any stock, and does not take account of your objectives, or your financial situation. We aim to bring you long-term focused analysis driven by fundamental data. Note that our analysis may not factor in the latest price-sensitive company announcements or qualitative material. Simply Wall St has no position in any stocks mentioned.
About SZSE:002737
Sunflower Pharmaceutical GroupLtd
Engages in the research and development, manufacturing, and marketing of Chinese patent medicines in China and internationally.
Flawless balance sheet and slightly overvalued.
